How to calculate the project margin in a marketing agency? And what is margin in general?
In this article, we will explain what margin is, how to calculate it, the types of margin, the difference between margin and profit – everything you need to know for calculating project margin in a marketing agency (and beyond).
What is Margin?
Margin is a financial indicator that shows the percentage of a company’s profit in the total cost of a product or service. It is calculated as the difference between the selling price and the cost price, expressed as a percentage.
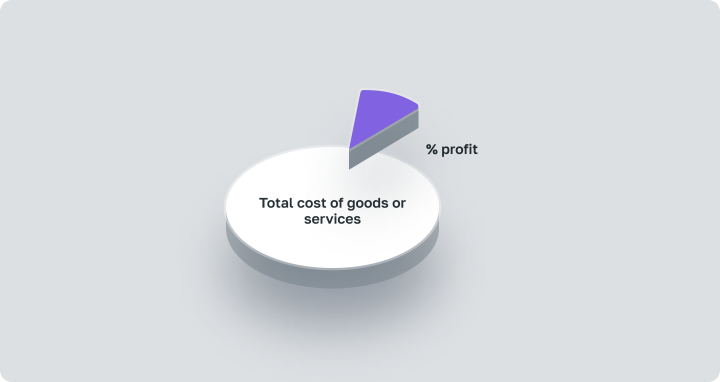
In marketing and advertising agencies, the margin represents the profit share of the agency in the invoice they issue to the client.
For example, if the promotion costs for a project are 10,000, and the client paid 15,000 for the services, the project margin is 5,000.
Often, when studying what margin is in trade, the concept gets confused with markup. Although they are equal in monetary terms, margin is always lower in percentage terms. This is because the margin relates to revenue, not cost.
Margin is calculated as follows:

The percentage value forms the business margin, indicating its ability to generate profit on invested capital. By the way, margin is the same as profitability.
Margin = Profitability
Project Margin in Marketing Agencies
The project margin in marketing agencies refers to how profitable each implemented project of the company is. Therefore, the margin is calculated for each project separately.
There are several margin indicators depending on which expenses are considered in the margin calculation formula. The indicator used for calculating business profitability is the net margin.
Net Margin is the money left in the company after paying all bills, including CEO compensation.
The universal formula for calculating margin is:

In Western agencies, a margin of 20 – 25% is considered good. A marginal profit level of over 10% is also a normal indicator. If an agency is in the growth stage and invests part of the profit into development, a lower margin may be expected.
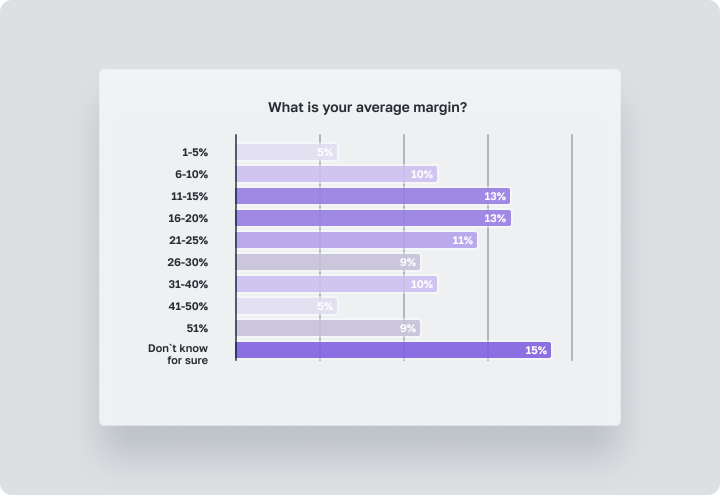
HubSpot, a marketing platform, surveyed nearly 800 department heads and top managers of marketing agencies in the USA, UK, and Canada. They provided data on their companies’ margins.
Types of Margin
The various types of margin include: gross margin, front-end margin, and back-end margin. Each type plays a key role in analyzing the financial efficiency and profitability of a business, reflecting different aspects of its income and expenses.Gross Margin
Gross margin is the amount of money that remains in the agency after deducting direct project expenses.
Indirect costs, such as rent, utilities, and administrative staff salaries, are not included. For a marketing agency, a normal gross margin is considered to be 50 – 60%.
In addition, large Western agencies calculate operating margin (share of operating profit in the company’s turnover), PBIT margin (profitability before financial income and taxes), and PBT margin (profitability before taxes).
Front-End Margin
Front-end margin measures profitability at the initial sales stage, usually considering income from the sale of goods or services before deducting operating expenses.
Front-End Margin Formula

This formula assesses the share of total income represented by net sales income before accounting for administrative, operating, and other expenses.
Back-End Margin
Back-end margin measures profitability after the transaction is completed, considering all discounts, bonuses, and additional expenses not included in the initial price.
Back-End Margin Formula

This formula calculates the actual profitability of a sale or project, taking into account all additional discounts, bonuses, and expenses that arise after the initial pricing.
Margin vs. Markup
Margin and markup are often mistakenly equated, but they are different. Margin is calculated once the service is sold and determines how profitably the company operates.
Markup or premium (markup) is the amount the company adds to the cost of its services to invoice the client.
Markup Formula

That’s why the values of markup and margin don’t match: markup is applied only to the cost price, while margin is calculated from the sum of the cost price and markup. As a result, the margin value is always lower.
Margin < Markup
The Difference Between Margin and Profit
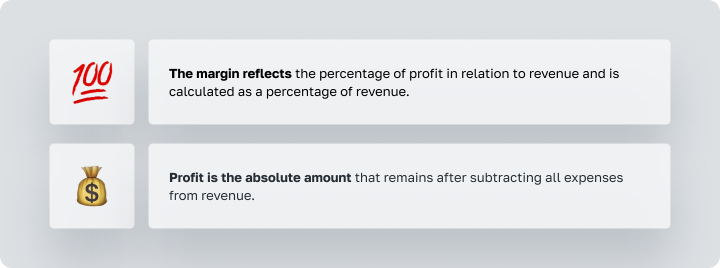
Margin is the percentage ratio of income to revenue, while profit is the quantitative amount remaining after deducting expenses.
Why Calculate Project Margin?
Margin is an important indicator of the profitability of the entire marketing agency and each project. Without calculating the margin, it’s unclear how profitably the business is operating and where it is heading.
If you do not calculate the margin, you do not understand how profitably the business operates.
With proper margin calculation, you can identify:
- How employee salaries affect project margins;
- The marginal profit of each project and the business overall;
- Which projects require the most resources;
- How much each service brings;
- The profitability dynamics of the company;
- The most valuable clients;
- Where the gross income goes.
Based on the obtained data, appropriate management decisions are made. For example, to reduce costs, increase service prices, or abandon unprofitable projects.
How to Calculate the Margin of a Marketing/Advertising Project?
To understand how to practically calculate a project’s margin, let’s go through this simplified algorithm:
Step #1 – Determine the Cost per Hour
The first step is determining the hourly rate of each employee. To do this, first calculate the total annual earnings.
For full-time employees on a full working day, this will include:
- Pension contributions;
- Insurance and bonuses;
- Gross salary;
- Other payments.

Knowing the hourly rate and the time spent on the project allows you to determine the direct expenses for the project.
Step 2 – Calculate Overhead Expenses
To determine the net margin, calculate both direct and overhead expenses for the year.
Overhead expenses include all expected costs not attributable to a specific project:
- Work hours not related to a specific project;
- Administrative staff salaries;
- Software, hosting, tools;
- Office equipment;
- Utilities;
- Entertainment expenses;
- Insurance;
- Transport;
- Rent.
Step 3 – Calculate Overhead Costs Per Hour
First, calculate the total paid hours of all employees for the year by multiplying the number of employees by annual working hours.
Then, divide the annual overhead costs by the paid hours:

Step 4 – Determine Gross and Net Margin for Each Client
To calculate the gross margin, subtract the total cost of the hours worked from the total value of completed contracts:

To calculate the net margin, include the overhead expenses:

To express the project margin in percentage, divide the margin in monetary terms by the total gross sales and multiply by 100%.

In practice, the calculation algorithm is much more complex: agencies employ specialists with different wages, projects can be long-term or one-off, and some work may be subcontracted. Thus, a large number of variables are involved in the calculation process.
Common Mistakes Leading to Reduced Business Margins
If you are dissatisfied with the result, you might be doing something wrong. Here are typical mistakes digital agencies make that potentially lead to reduced business margins:
- Performing unpaid work, i.e., completing client tasks not included in the agreed project scope. This can lead to significant unforeseen expenses. If this is a conscious choice to gain client loyalty, highlight the provision of additional services as a gift or special offer.
- Not accounting for all time spent on the project. Neglecting accurate time tracking can lead to incorrect billing. This is important for both hourly and fixed payments to understand the effective use of time and resources.
- Failing to analyze mistakes after project completion, leading to repeated errors. Hold post-project meetings with the team to answer questions: What was done well? What didn’t work out? What should be done differently next time?
- Underestimating project costs due to the fear of losing a client. Regularly review the cost of services, compare prices with competitors, and adjust accordingly.
- Reducing prices during negotiations with potential clients out of fear of missing out on the deal. In reality, reducing prices during client negotiations is rarely compensated. It can lead to budget and workload reductions in both the short and long term.
Tools for Calculating Margin and Project Management
Omni Calculator
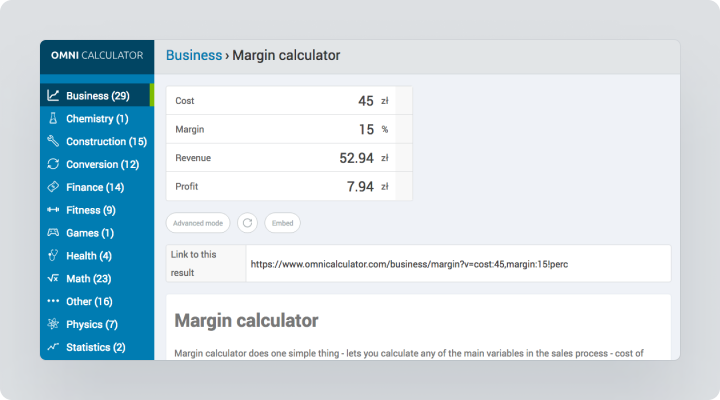
Omni Calculator is a simple online calculator. It calculates net margin, gross margin, margin including taxes, and markup. The resource offers several dozen calculators, including four marketing ones.
Ultimate Margin Calculator by Lemonade Stand
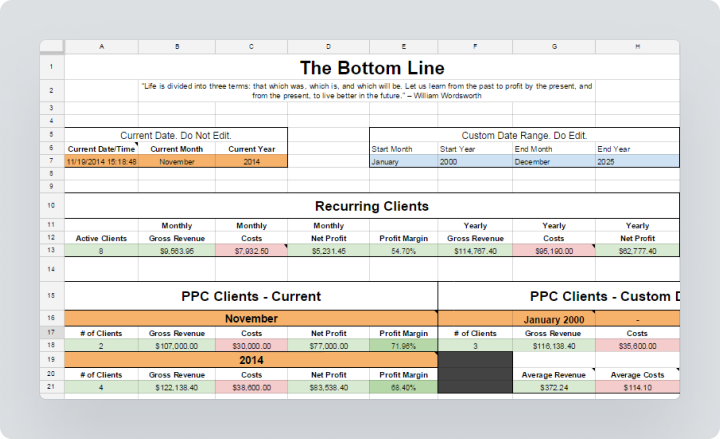
The marketing agency Lemonade Stand developed the Ultimate Margin Calculator for their own use and decided to share it with the world. It is available in Google Sheets along with usage instructions.
The document has separate sheets for calculating the margins of regular clients, PPC clients, and one-off projects. The calculator is suitable for both large agencies with many clients and employees and small companies with 3 – 4 employees and several projects.
TrinityP3 Calculator
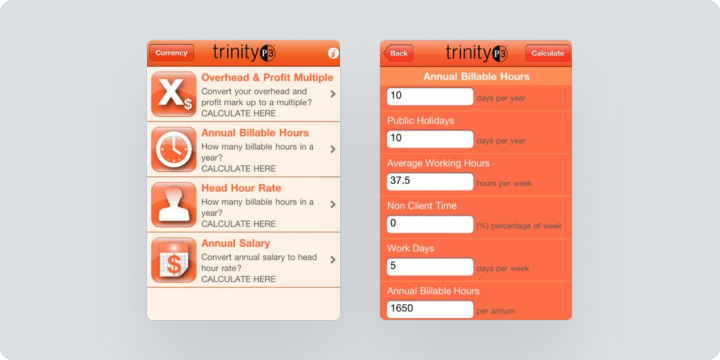
An online calculator that calculates annual and hourly salaries, the number of paid hours, and the overhead cost and margin multiplier. Apps are available for Android and iOS.
Margin and Worksection
Worksection helps calculate margin by providing tools for effective resource management. The system allows you to track time spent on various project tasks and allocate expenses, enabling precise project cost calculations.
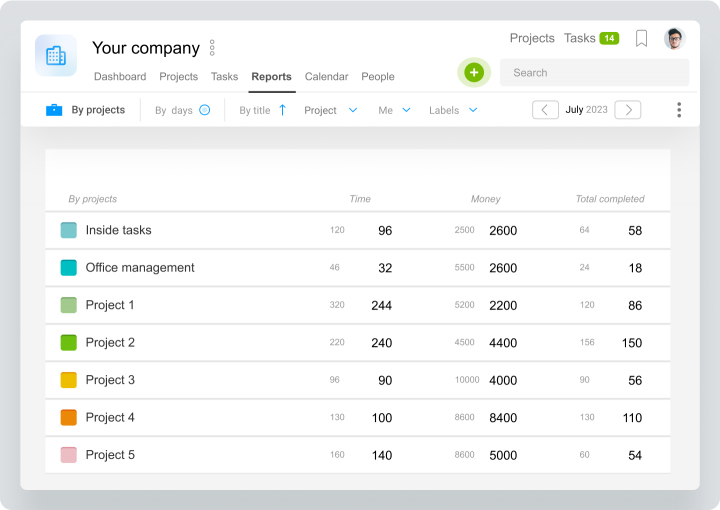
Reports and Budget Control in Worksection
Reports in Worksection provide a detailed overview of the project’s financial indicators. This information helps calculate and control the margin.
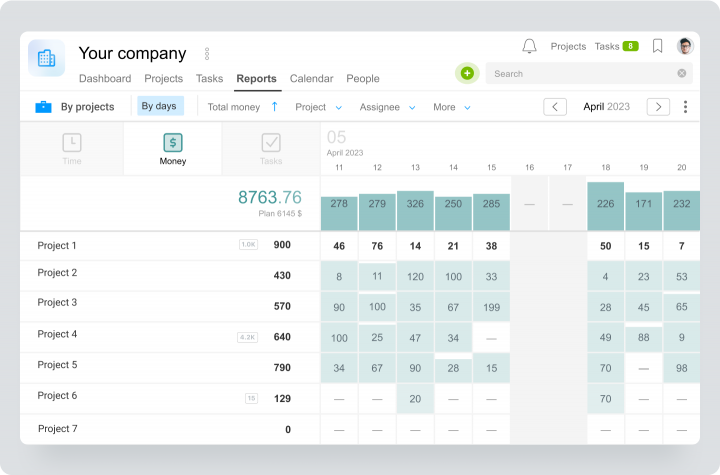
Worksection provides detailed reports on budgets and expenses, allowing analysis of the project’s financial performance. This way, project managers and financial analysts can make decisions based on current financial data.
Conclusion
Margin is a key indicator of business financial efficiency.
The marginal profit of an advertising project or marketing agency’s services shows how well the costs of project promotion and office maintenance are covered. Calculating the margin of each project allows for analyzing the agency’s order portfolio and adjusting operations. Not calculating margin is akin to running a business blindly.
Worksection is an assistant that effectively aids in calculating project margins by providing users with tools for precise resource tracking. This allows project managers to optimize profitability and contribute to the overall success of projects.