Lack of understanding of project timelines, constant delays, difficulty in coordinating processes with contractors. The budget is growing, and the result is constantly postponed. This is the reality of many projects where there is no tool for coordinating and planning processes.
The Gantt chart allows you to visualize all tasks on a common timeline. This gives the manager the ability to see how the stages are connected, understand the team’s workload, and make quick decisions depending on the circumstances.
What is a Gantt chart?
Imagine you’re designing a house. All construction processes have their own sequence. First, you need to prepare the site, then pour the foundation, build the walls, install the roof, and conduct communications. If there is a delay somewhere, the entire schedule shifts.
The Gantt chart is a tool that forms the logic of such workflows visually. Each stage is marked with a segment on the timeline, which are interconnected by dependencies.
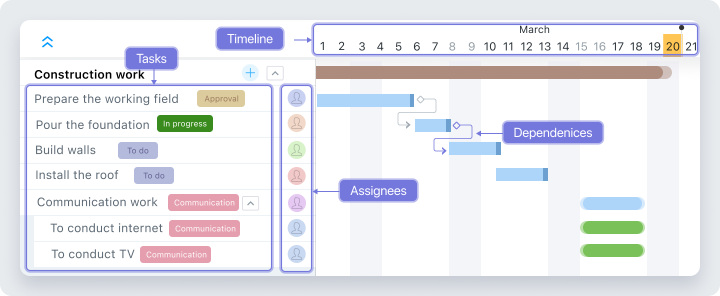
Key components of a Gantt chart
- Deadlines and duration. Each task has a defined start and end. You can see the duration of each task, how they intersect with each other, and when the project is due to end.
- Dependencies between tasks. In a Gantt chart, you can set a logical sequence of steps and link them together. For example, you can only start the “Pouring the foundation” task after the “Site preparation” task is completed.
- Responsible. Each task is assigned to a specific performer. This allows the manager to see in real time who is working on what and quickly eliminate possible problems during execution.
Worksection’s Gantt chart
The Worksection’s Gantt chart is one of the built-in ways to display tasks. This means that the tool is ready to use without any additional settings or integrations. To start using it, you just need to fill the project with tasks and switch to the appropriate display mode.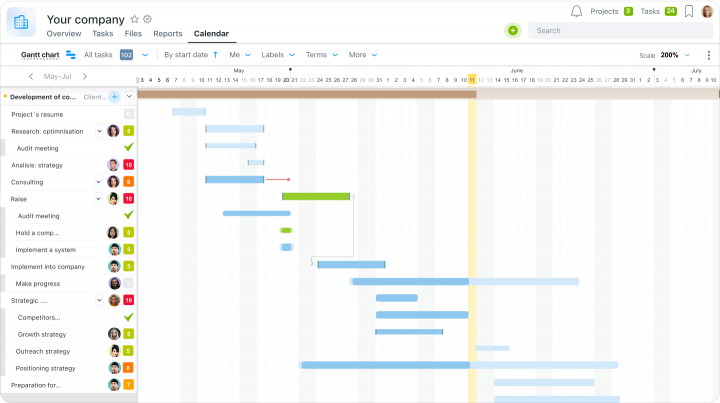
The Worksection’s Gantt chart is also interactive. Move task segments, set dependencies between them, and adjust the total project duration — all in one place.
Features of the Worksection Gantt chart
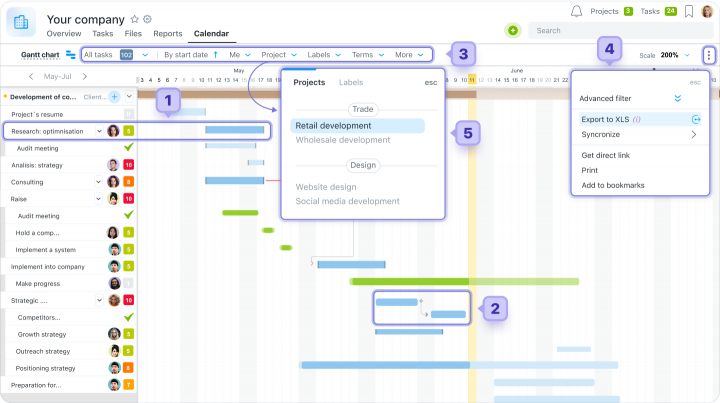
- Edit tasks directly from the timeline in real time;
- Setting dependencies between tasks;
- Setting filters to display only the information you need;
- Export a chart for reporting or presentations;
- Switch between viewing a single project or all account activity.
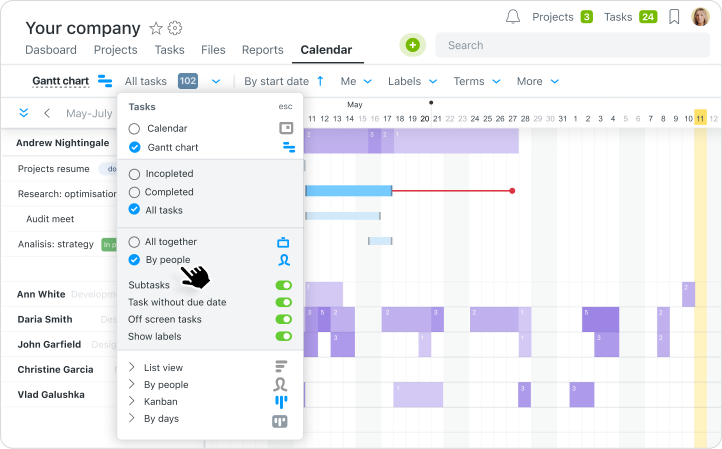
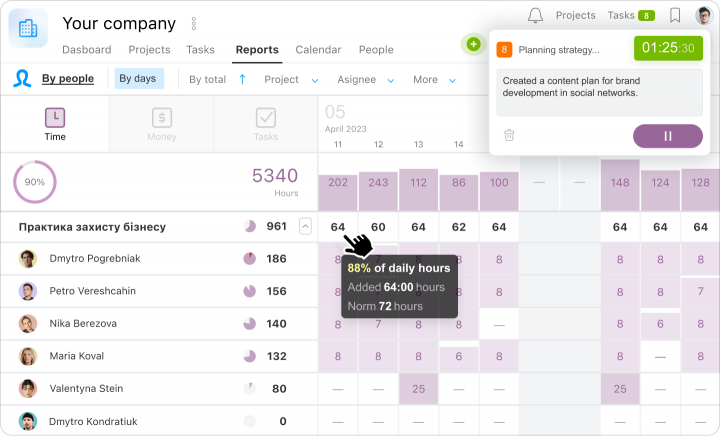
You can also control the workload through the “By person” view. The system automatically shows how many tasks are assigned to each team member. This helps to avoid overloading individual members and distribute tasks evenly.
Learn more about what the Gantt Chart looks like and what it does in Worksection on our YouTube channel 
The impact of a Gantt chart on a project
Teams face typical management challenges that can be avoided by implementing a Gantt chart. Among them:
Lack of a big picture of the project
The problem: Project participants know only about their tasks. The manager doesn’t see what is delayed where, and the team doesn’t understand how everything is connected.
 Solution: The Gantt chart shows all tasks on a single timeline. You can see the deadlines, people in charge, and stages. This synchronizes the team and allows them to quickly identify problem areas.
A delay in one stage affects the entire project
Problem: One overdue task affects all subsequent ones. As a result, teams can be forced to stand idle, and businesses can lose money.
Solution: The dependencies between tasks in the diagram show how one delay affects other stages. You see the phased plan and control the actual execution.Inability to accurately predict project duration
The problem: Without a clear structure, you can’t estimate how long a project will take and when it will be completed. This makes it difficult to plan your workload and launch new projects.
Solution: A Gantt chart timeline helps you set deadlines for each stage. You see a clear plan and can track how well the team is on track.Uneven team workload during the project
The problem: Some team members are overloaded, while others have time reserves that are not used. This leads to burnout and budget losses.
Solution: The Gantt chart feature in the By People section of the Workspace shows how many tasks each team member has. This allows you to level the workload and maintain team productivity.Pros and cons of the Gantt chart
A Gantt chart is a convenient way to see the progress of a project. The tool helps to better plan tasks, distribute workload, and control deadlines. But before full implementation, it’s worth considering both the advantages and limitations.
Advantages of the Gantt chart
- A complete picture of the project
- Visibility of dependencies between tasks
- Workload planning
- A clear plan for the whole team
Disadvantages of the Gantt chart
- Difficult to set up
- May not be useful for simple projects
Comparison of Worksection’s Gantt chart with competitors
Besides Worksection, there are many analogs of project management systems with Gantt charts. We’ve compared three popular solutions — Worksection, Trello, and GanttPRO — to show the features of each platform.
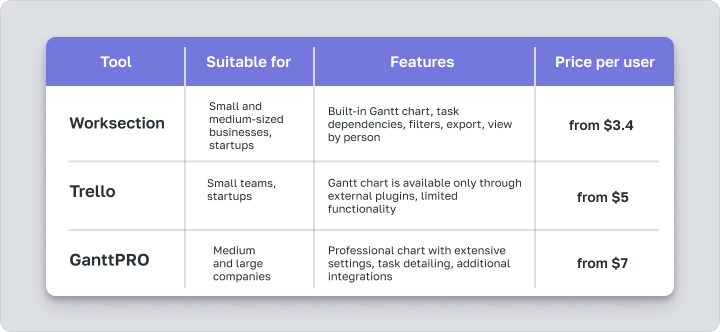
So, Trello provides access to the chart only through third-party plugins, which creates additional complexity and limits functionality. GanttPRO is a specialized system, but you’ll have to pay much more to use it. On average, a GanttPRO subscription costs twice as much as Worksection.
Worksection offers a built-in Gantt chart without the need for additional customization or plugins. You get full functionality: links between tasks, real-time updates, filters, exports, team workload view.
Who is Worksection’s Gantt chart for?
The Gantt chart is suitable for projects where tasks are in a certain order and depend on each other. The tool displays the entire work plan, which allows you to control the sequence and distribute the workload.
Who is it for?
The Gantt chart is suitable for business types where tasks are interdependent and there is a need to constantly synchronize processes:
- Construction — planning work, stages, contractors.
- Architecture and design — coordination of technical solutions, schedule of stages.
- Production - control of processes from layout development to delivery.
For whom it is not suitable
The Gantt chart is not suitable for projects with repetitive tasks, where the basis of management is to control the status of tasks. For such a request, the best choice is to work with a kanban board. The tool allows you to quickly move tasks between statuses and keep your focus on current progress.Worksection is more than a Gantt chart
Worksection is a project management service that helps organize team work and monitor project progress at all stages. You get not only a Gantt chart, but a full set of tools for effective daily work.
Time and resource management
Worksection allows you to track the time spent on each task and compare it with the planned amount. You can see how much time each team member spends, which tasks consume the most resources, and whether the team is on track. This approach is especially useful for service companies and teams that work on an hourly basis.
Different formats for displaying tasks
Worksection supports several task display formats: Gantt chart, Kanban, and list. This allows you to adapt the interface to the usual processes of each team individually.
Convenient task manager and task structure
Worksection allows you to create tasks with subtasks, add descriptions, checklists, files, deadlines, performers, and labels to them. This helps to conveniently structure even complex projects, avoid losing anything, and see the overall progress at each stage.
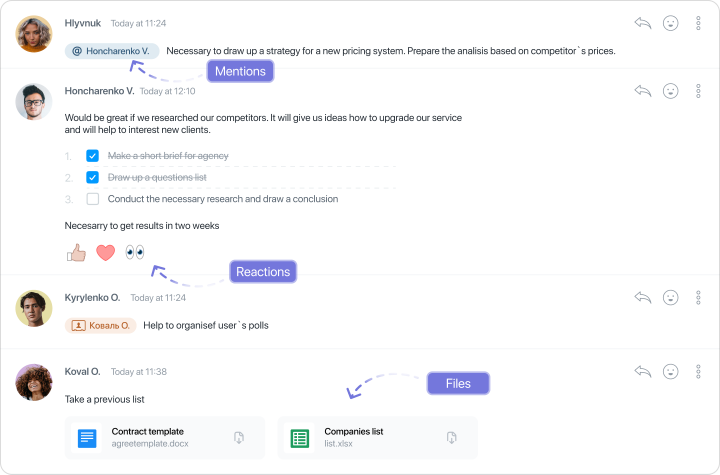
Communication within tasks
Comments in Worksection tasks store all important information in one place. You can mention colleagues, attach files, and have discussions right in the task. This way, work discussions don’t take place in messengers or third-party chats, where information is often lost.
Setting up access to work with contractors and clients
Worksection makes it easy to work with contractors, freelancers, or clients. You can grant limited access to only those tasks that are relevant to them without the risk of revealing unnecessary information. This is especially useful for agencies, service businesses, and teams that involve freelancers in their processes.