Project managers sometimes plan the duration of a project based solely on their own experience. However, calculations based on the most successful and unsuccessful tasks they have executed are likely to be inaccurate.
Some managers may unconsciously think, “I see what I want to see”. It’s common for a manager to trust information that aligns with their worldview, while ignoring data that does not meet their mental approval.
Another challenge in project scheduling is the complexity of relationships between different risks. Events can occur at any time during the process, correlate with each other, or trigger other uncertainties. The same event can have varying impacts depending on the circumstances, and the manager might “extinguish the fire” in different ways.
Event Chain Methodology (ECM) assumes that no matter how well the project schedule is prepared, events will occur that will alter the planned timing. The main task is to identify them in advance to manage them. ECM is not focused on constant problems because these can be identified and corrected without special analysis.
Visualizing risks to study them more easily is another important task for the methodology.
Origin
The Event Chain Methodology emerged by the end of the 2000s based on other risk analysis tools. The Project Management Body of Knowledge (PMBOK Guide) recommended techniques for risk analysis in 2008: decision tree analysis, Monte Carlo simulation, and sensitivity analysis. The last two approaches became the foundation for Event Chain Methodology.
The Monte Carlo method helps calculate the statistical distribution of outcomes based on data with a certain probability. Sensitivity analysis identifies risks with the greatest impact on processes.
Another part of the methodology is the graphical description language for modeling business processes, UML. Visualization of connections between uncertainties was actively used in software development and involved creating Gantt charts and other event network diagrams.
Forecasting techniques that analyze historical data are also used. Similarities between past and current processes are identified.
Forecasting techniques that analyze historical data are also used. Similarities between past and current processes are identified.
These techniques form the basis of the event modeling method. Under their influence, the project schedule is created as follows:
- Prepare the project schedule for the optimal scenario. Calculate the duration, cost, and other key parameters. Remove optimistic indicators from the calculations, as project managers often incorporate overly ambitious figures due to overconfidence, miscalculations, or team motivation.
- Create a list of events and event chains. Predict their likelihood of occurrence and their impact on resources and company activities.
- Conduct a quantitative analysis using the Monte Carlo method. This will help you determine how realistic it is to complete the project by the specified date without unforeseen costs.
- Conduct a sensitivity analysis to identify events and event chains with the greatest impact on the project. Verify the data to assess if the likelihood of events is accurately determined.
- Repeat the analysis during the project based on real data and whether the predicted events occurred. Reassess the probability and impact of risks based on current indicators.
Principles of ECM
Identify the Moment of Event Occurrence and the Excited State
Processes are usually not constant and uniform. They are influenced by external events that change their state. When the conditions of the process change — requiring other resources or more time — it enters an excited state. Before the changes, it was in its initial state.The process state can be tied to an event. For example, holding an open-roof meeting depends on the external event “bad weather.” If it rains, the process will move to an excited state — the meeting will be held indoors. Now the process is not dependent on the “bad weather” event.
An event has an impact and a probability. Suppose a process is tied to the event “Requirement change.” It can occur with a 50% probability and cause a 50% delay compared to the initial state. However, if this scenario repeats, the delay may be only 25% since management took certain measures last time to mitigate it.
An event’s impact can lead to process delays, restarts, cancellations, or the need for new resources and measures.
Each event has a moment of occurrence. It can be absolute, tied to a specific date, or relative — occurring at the beginning, middle, or end of the process. The timing of the event influences its impact.
Define Event Chains
Some events may trigger others, forming event chains. For example, a requirement change led to a process delay, and to accelerate it, the manager allocated resources from another process. As a result, deadlines are missed, and the project overall fails.
The event that triggers the chain is called the initiator. The event that “takes over” is the receiver. The effect resulting from the event chain is called multicasting.
Event chains cause more delays than independent events. Below is an example of such an impact on three processes in a project, each with a 50% probability of restarting and lasting 5 days. The analysis was conducted using the Monte Carlo method.
Visualization and Analysis
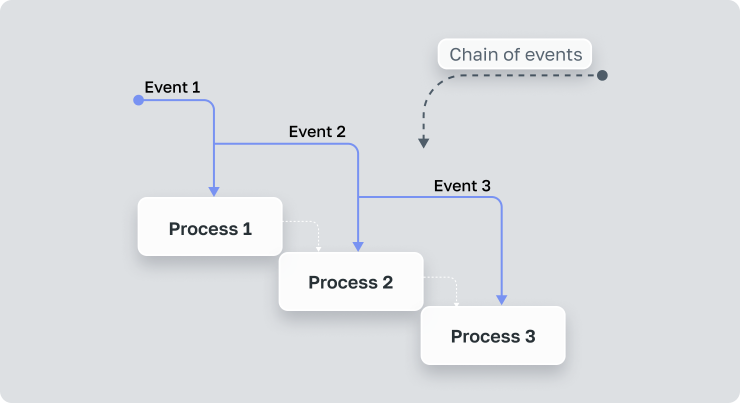
Visualizing relationships between events can be done using Gantt charts. Here are the rules for creating them:
- Show events as arrows with labeled names.
- Display negative events with downward arrows and positive events with upward arrows.
- Connect events in the chain with lines.
- An initiating event with multiple lines to receiving events is considered multicasting.
- Show global events that affect all processes outside the Gantt chart. Indicate threats above the diagram and opportunities below.
Monte Carlo Simulation for Risk Analysis
Once risks, event chains, and their associated process states are identified, use the Monte Carlo method to determine the overall impact of events.Even when all risks are identified, uncertainties related to project cost and duration always exist. To account for them, calculate the statistical distributions of start time, duration, and project cost. Do not use the same causes that you attributed to events to avoid overlapping risks.
Follow these steps for a correct Monte Carlo analysis:
- Calculate the moments of risk occurrence based on the statistical distribution for each state.
- Check if initiating events will occur at the given probability.
- Determine if you need to update the probabilities of receiving events for this experiment.
- Check if receiving events occurred at the given probability.
- Analyze each process in both initial and excited states.
- If an event causes the process to be canceled, mark it as such and account for new costs and time in the project plan.
- If an event causes another event — manager intervention as a mitigating action — adjust the project schedule accordingly.
- Consider the cumulative impact of events on project cost and duration along with duration and cost fluctuations.
The result will give you the probability of successful project completion and the likelihood of individual processes being completed.
Finding Critical Event Chains and Event Cost
Events or event chains with the highest probability of affecting processes are called critical. Identify them during sensitivity analysis by examining correlations between key project parameters such as cost and duration and event chains.
Use a sensitivity table to track critical events or chains.
Conclusion
Motivational factors impact key process parameters more than risks. Event Chain Methodology helps overcome selective perception, manager bias towards information that aligns with their principles, overconfidence, and planning errors.
ECM considers factors overlooked by other risk analysis techniques: risk occurrence moments, event chains, delays in event occurrence, and mitigating actions. To simplify the identification of events and their chains, create diagrams and process state tables.
The methodology includes risk analysis and schedule adjustments during the project.