
Hello, Friends!
At the beginning of 2022 we are happy to introduce an awesome update for all managers and project leaders. We added the Project Dashboard (Overview) — a new block with a number of different performance indicators to provide you with a quick analysis of the present state and the scope of performed project activities.
In this article we are going to tell you more about this new function and its settings.
Key project indicators (dashboard)
 Wiki: Dashboard (key indicators panel) is a visual tool for data analysis, which facilitates the understanding of the current state of a project and the key metrics in real time.
 A project overview dashboard will be available for all tariff plans, except a free trial. If your dashboard is not fully functional, this means that you are using a retired tariff. Please, contact us, and we will help you migrate to a new tariff which will have this and some other additional functionality available.
You can access the dashboard page in any project by simply opening the first page Overview / Dashboard. This section was completely changed and updated with different metrics, offering you the following possibilities:
- to track project progress
- to analyze team’s engagement
- to track financial and non-financial costs
- to quickly collect statistics for team meetings
The list of overdue tasks, tasks with approaching due dates and recent events’ feed was divided into blocks for more flexible set-up and data analysis.
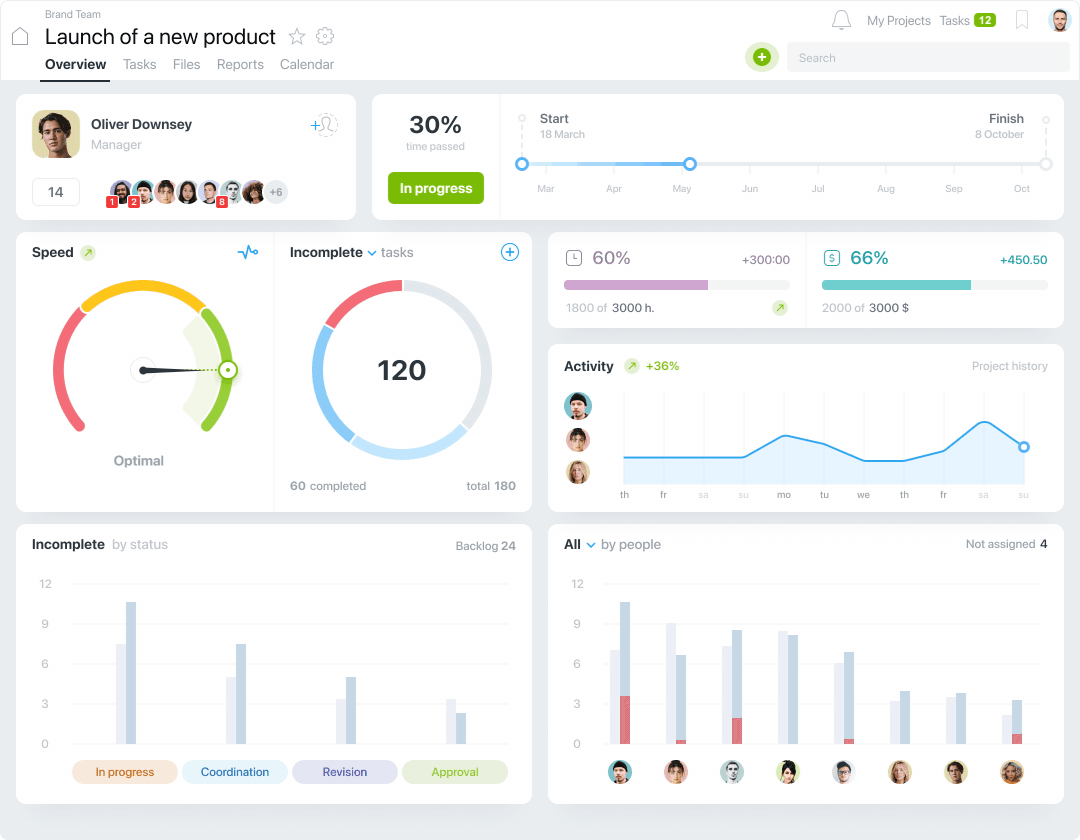
An example of how the page Overview / Dashboard is displayed
Team and Project Timeline
Team block contains information on the Project Manager and members. The number under the manager’s avatar shows the total number of executives and uncovers the full list of their names when you click on it. If necessary, you can easily invite new members directly from here by clicking the corresponding field.
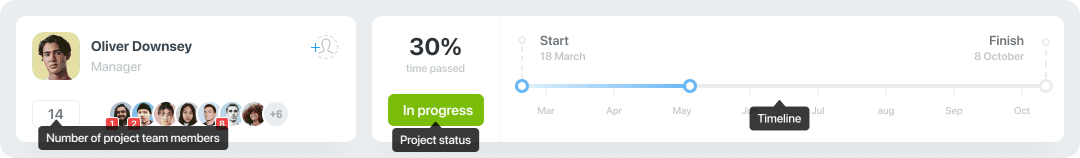
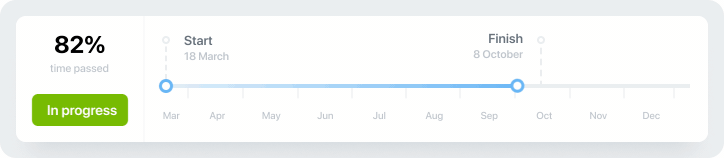
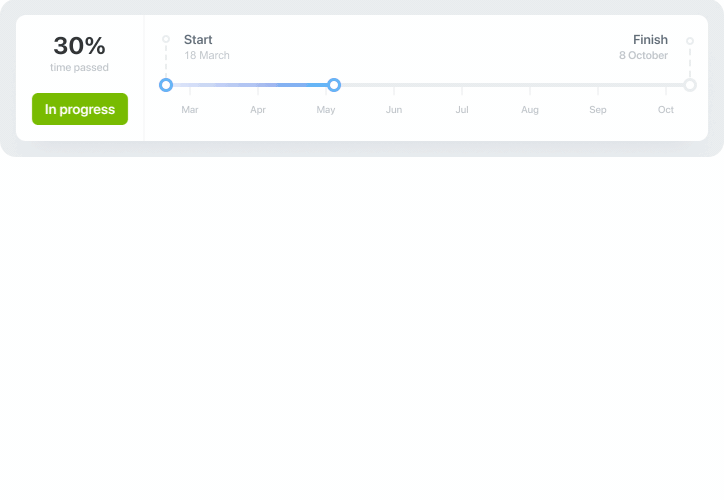
Timeline block displays detailed information on project timing. If you indicate a project completion date, the system will display the percentage of time passed from the starting date.
In case of delay with task completion and shifting the deadline, the system will warn about the deadline changes of the whole project and indicate the estimated date of project completion based on the terms for the last task of the project.
The red line of the diagram will show the delay period from today till the planned project completion day.
For PRO tariffs the current stage of the project will be displayed. Using the sequence of stages you can set a complete workflow for a project, for example «Preparation — Approval — In progress — Completed».
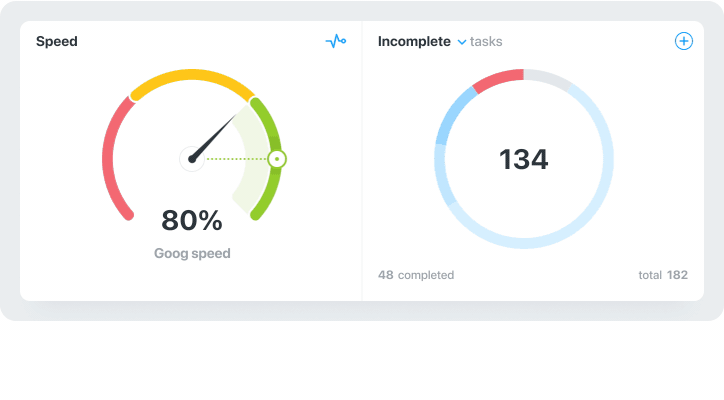
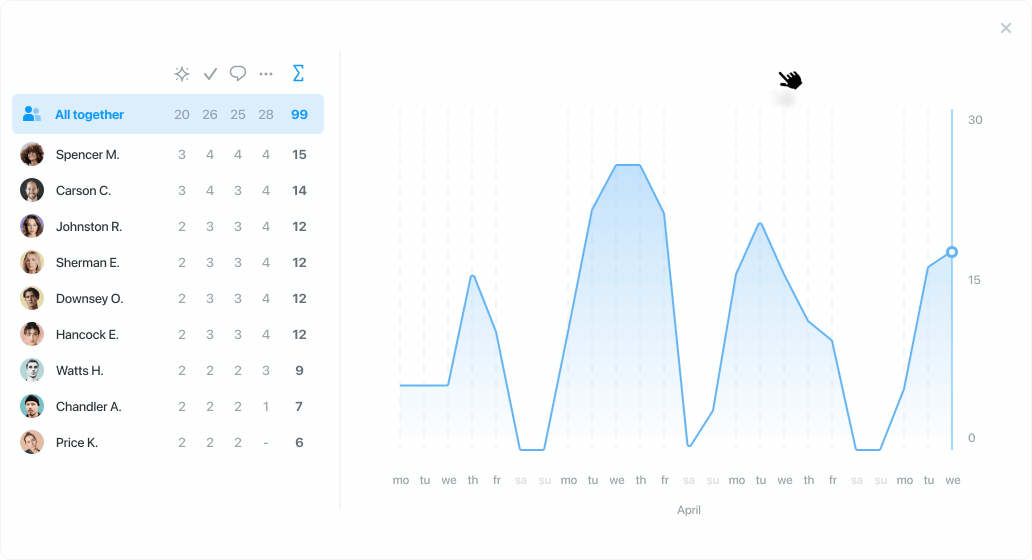
Project rate
We also added a smart Rate indicator for a quick project analysis. It displays how fast your team is proceeding, and prompts when it is necessary to speed up.
 Attention: For an adequate rate estimation, please, indicate the project completion date and complete more than 5 tasks from the start of the project.
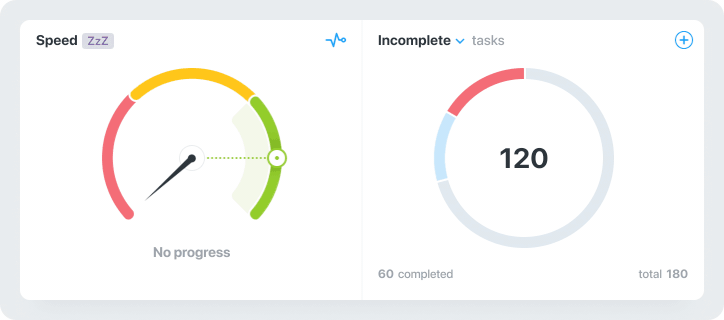
When moving the pointer to the graph of the project rate an additional prompt with detailed information will be displayed, covering the number of the completed tasks for the current and previous weeks and an average rate of task completion, as well as recommendations for the optimal performance rate (a number of completed tasks) for a week.
When clicking the graph of the project rate the additional charts of Burn-up format are displayed: Project completion rate.
Wiki: Burn-up is a visual diagram used in Agile projects to measure progress. These diagrams allow project managers and teams to quickly see how their workload is progressing and if the project completion is on schedule.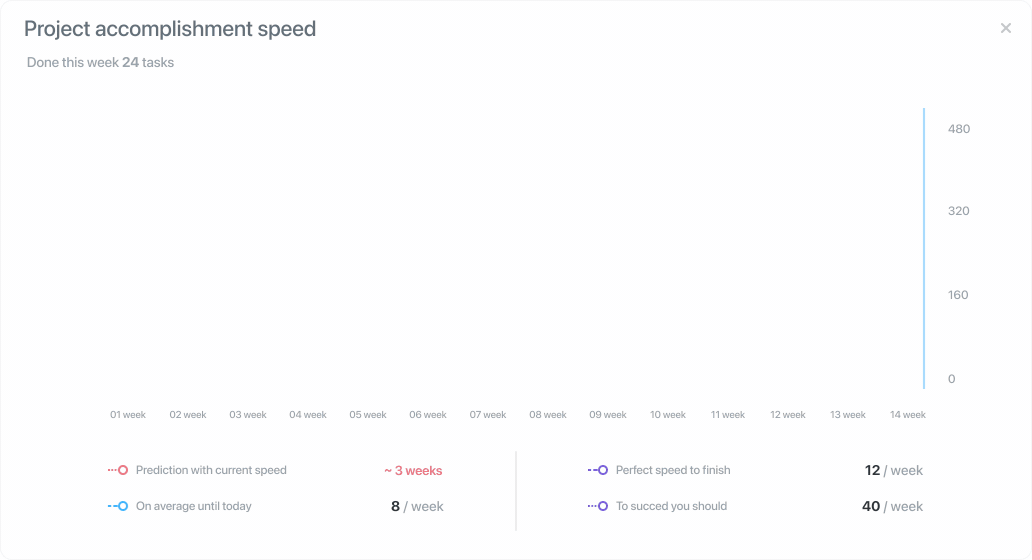
Task completion rate shows the progress of your team in project implementation and the ratio of the completed tasks to their total number. The ideal rate of task completion (displayed as purple line) serves as a guideline in the rate of task completion that your team should aim for in order to complete a project in time. The red line shows an estimated trend based on the average rate of task completion for the previous two weeks.
Moving the pointer over the graph will show the data on the completed tasks for a particular period in figures.
 Advice: To provide a realistic display of the ideal curve of project performance it is advised to indicate the completion date in tasks.
Information on tasks
Tasks block displays current information on the ongoing and completed tasks, and if necessary, gives possibility to quickly create a new project task by clicking a plus icon (+).
Note: When clicking the current type of tasks (ongoing / completed) next to the block title, the graph will switch from ongoing tasks to completed and vice versa.
Ongoing tasks include:
- overdue tasks — the tasks with past deadlines
- without due date — the tasks, for which no completion date was set
- pending — the tasks for which the starting date has not come yet
- expiring — the tasks with 7 and less days before deadline
- started — the tasks with past starting date
Completed tasks include:
- delayed — the tasks which were not completed in time
- timely — the tasks which were completed in time
- without due date — the completed tasks, for which no completion date was set.
Note: All information in the circular chart is interactive, by clicking a particular sector you can go to the detailed filtered task list.Project costs
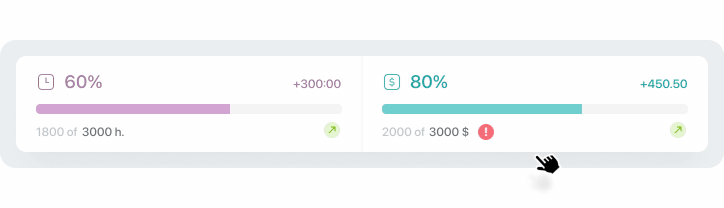
Project costs block displays the current amount of time and financial expenses. The indicators in the bottom right corner show the comparison of the current costs with the last week values.
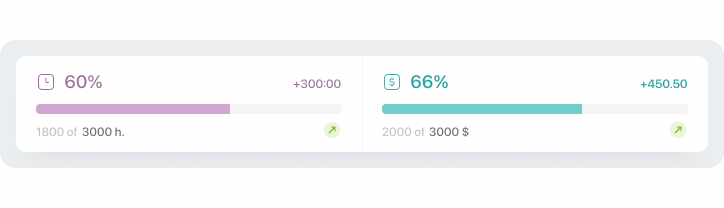 Note: You can change the estimated costs of the project by clicking the corresponding figures in the Project costs block.
In case the planned task costs deviate from the general project costs the system will warn you with a red icon and display corresponding figures.
You can expand the data on time expenditure into the detailed graph of Time expenditure dynamics.
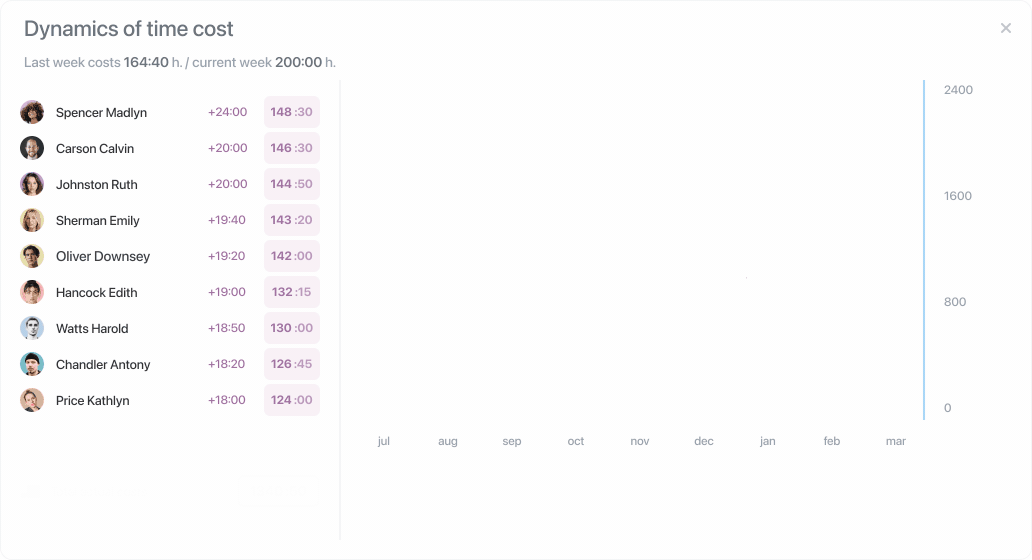
The graph shows how the team accounts time expenditures in tasks and compares the obtained values with planned ones, estimating the project costs based on the current performance rate.
Moving the pointer over the graph, you can review data on time expenditures for a particular period.
Advice: For accurate data we recommend you to indicate the planned time when you create a task with further recording the actual time spent for this task by each employee using a built-in Timer.Project activity
Project activity graph shows daily activity of members and displays top 3 most active users. It helps to recognize periods of the most active work on tasks within a project, as well as the periods of downtime. The progress indicator next to the block title compares the activity of a current 7-day period with the previous one.
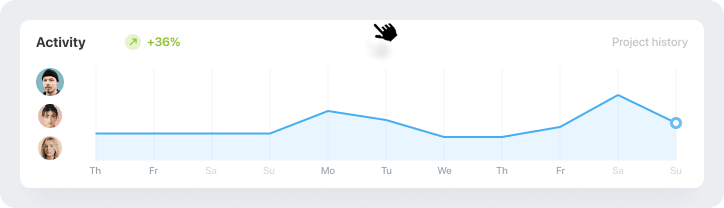 Note: Clicking at any place of the block will display the detailed activity history of this project.
 The term «activities» refers to any actions of a user, which are tracked in the project history. These could include created and completed tasks, posted comments and other actions associated with the tasks in this project.
Task statuses
Tasks by statuses block (Task status report) (Kanban boards) reflects all stages (statuses) of the workflow, which is applied to this project. The current data is also compared with the values for the previous 7 days (a semi-transparent column on the left).
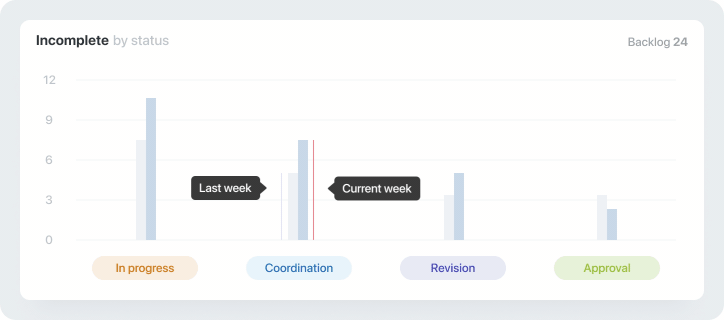 Wiki: Backlog is a list of prioritized tasks to be done by the project team. The most important tasks come at the beginning of a project backlog, for a team to realize which tasks have to be done first. The tasks in the backlog are neither assigned to anyone, nor have any particular status.
Tasks by members
Tasks by members block shows information on the ongoing, completed and general number of tasks for each team member. The current data is compared with the values for the previous 7 days.
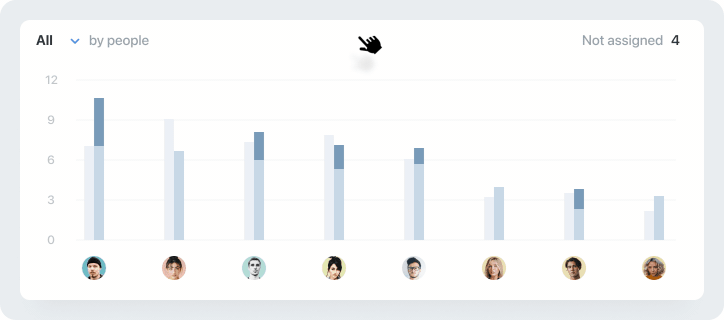 Note: When clicking the data of any employee, the system will display a list of tasks, filtered by the responsible person for this employee.
Not assigned — displays the number of tasks in this project, which are not assigned to any particular employee, and «any employee» is displayed in the field for the responsible person. The tasks «without a responsible person» are not displayed in this block.
Note: If you click the current task type (all / ongoing / completed) next to the title of the block, the graph will switch between all tasks, ongoing tasks or completed tasks.Overdue tasks, upcoming tasks and recent events
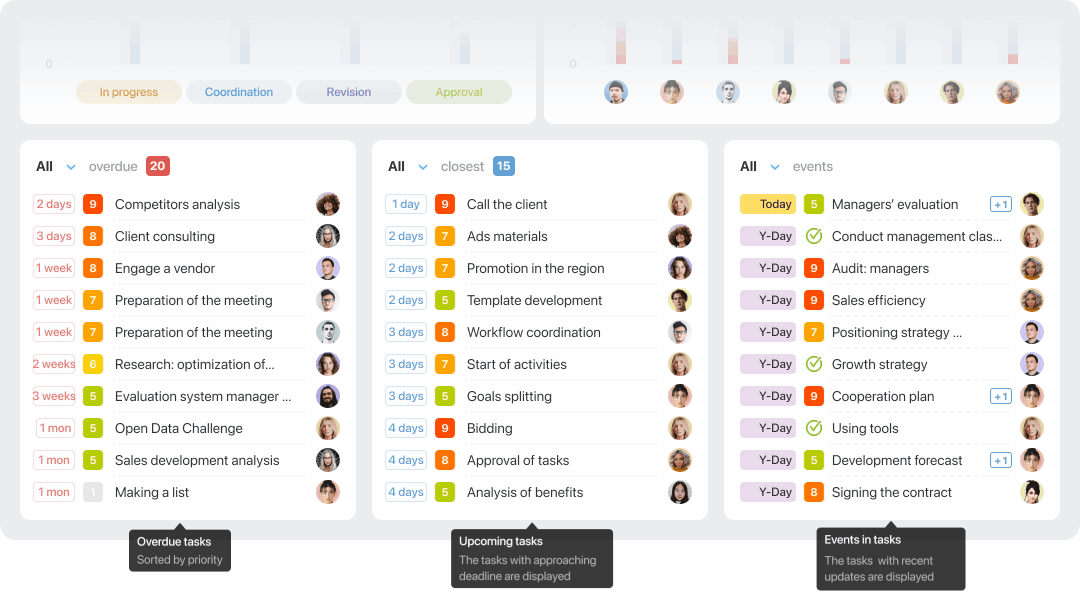
In each block you can choose the necessary data type for display — All tasks, Subscribed tasks, My tasks.
All tasks are interactive and a particular task or event is opened in a new tab when clicked.
Note: Only the upper part of the list of actual tasks is displayed by default. Click the three dots (...) at the bottom of the block and open the full list of tasks. Overdue tasks
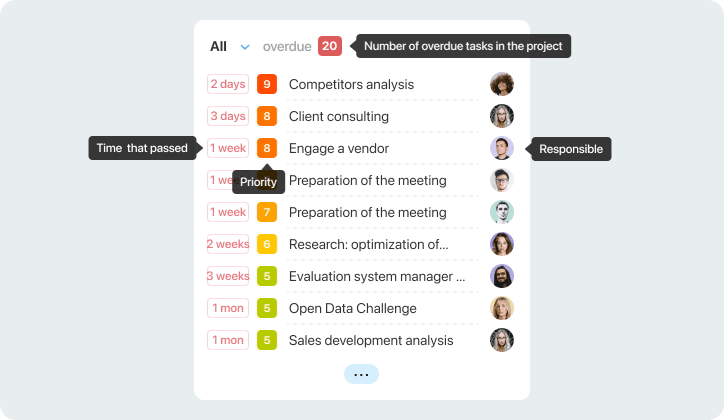
The information of this block includes:
- number of days or months that passed from the planned completion date
- priority level
- task name
- responsible person
Tasks in this block are sorted by priority, with the most pressing items coming first.
Upcoming tasks
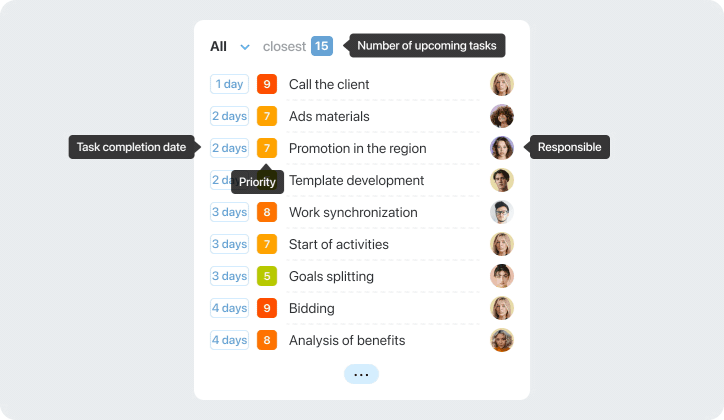
The information of this block includes:
- completion date of the nearest tasks
- priority level
- task name
- responsible person
The tasks in this block are sorted by the event date, with the nearest items coming first.
Recent events in the project
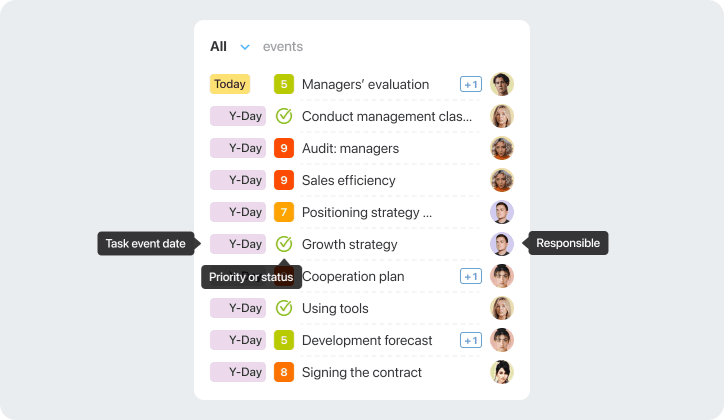
The information of this block includes:
- event date in the task, for example creating or completion of the task, posting a comment etc
- priority level or the task status
- task name
- responsible person, with the number of comments indicated next
Note: For completed tasks the status «completed» is displayed instead of the priority level — grey (for tasks with no due dates), green (for timely completed tasks) and red (for the tasks completed with delay).In the meanwhile, we have already started working on the overall Account Dashboard and your suggestions on its contents would be very helpful.
Leave your comments on which data, indicators and diagrams would help you to quickly analyze the work of the whole team in all your projects and tasks.
Thank you for choosing our service for your task and project management!
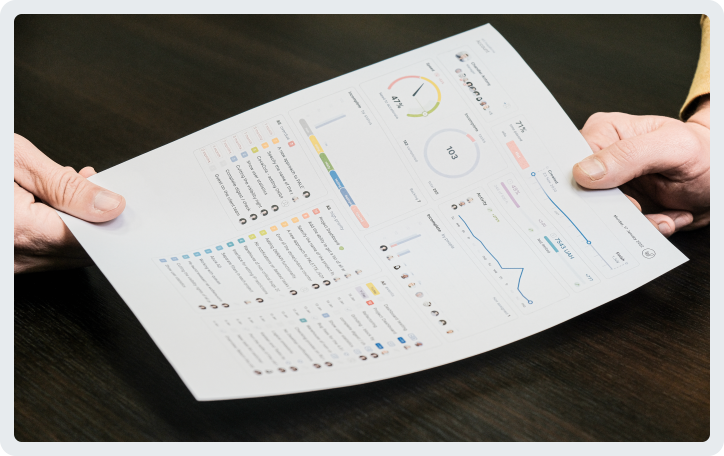
By the way, Dashboard can be printed out, for example at a meeting with colleagues :)
Have a productive and efficient 2022 ahead!
Worksection Team
For the overall Dashboard, it would be awesome to get an overview of the workload for the whole Account and broken down to each Team Member. Defining max working hours a day for each Member (excluding holidays) it might be possible to get an rough overview of the remaining team capacities and be able to define timelines for upcoming projects - more reling on insights than on dreams ;-)