Dashboards are an essential project management tool. They provide a single place to monitor tasks, track time and measure progress. They simplify complex workflows, improve collaboration and provide a clear view into the status of a project.
Choosing the right dashboard application is critical to productivity, whether you’re managing a small team or a large organization. Leading tools include Worksection, Jira, Notion and Monday, which address needs different project needs.
This article examines the key features, customization options, and usability of these services to help teams find the best tool for their specific needs. Users can make informed decisions based on their team size, project type and required level of functionality by examining how each application approaches dashboard creation.
Introduction to Dashboard Creation Across Platforms
Dashboards serve as a command center for teams to keep track of tasks, schedules, and progress. Each system brings a different set of features to the dashboard that are tailored to meet different user needs.
- Worksection: Worksection combines an intuitive interface with powerful project management tools. Its project dashboard automatically gathers key performance data in one place. No additional setup or customization is required.
- Jira: Ideal for technical teams and agile workflows. Jira is known for its advanced customization tools. Its dashboards focus on issue tracking and project sprints, making it a top choice for developers.
- Notion: Notion enables users to create highly customizable and flexible dashboards. It appeals to creative individuals and teams in search of a visually appealing and adaptable workspace.
- Monday: With vibrant, widget-rich dashboards, this system emphasizes collaboration. It’s a good fit for teams that value online real-time updates and simplified visual task tracking.
| Platform | Primary Purpose | Dashboard Customizability | User Type |
| Worksection | Project management key indicators tracking | Moderate | All users |
| Jira | Issue tracking and Agile workflows | High | Intermediate-Advanced |
| Notion | Creative task and data project management | Very High | Beginner-Intermediate |
| Monday | Team collaboration and task tracking | Moderate | Beginner-Intermediate |
A Step-By-Step Guide to Creating a Dashboard in Each Platform
How to Create a Dashboard in Worksection
The key feature of the Worksection project dashboard is its simplicity. It’s already built into your project, so there’s no need to set it up. The dashboard provides a clear overview of all project activities and is visible to all participants.
Let’s explore the key features of the Worksection dashboard to help you unlock its full potential.
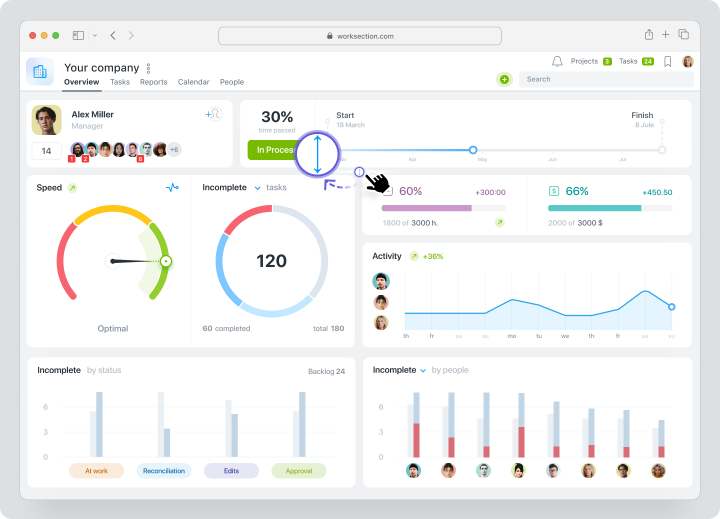
Step 1: Dashboard view in Worksection
The dashboard gives you a real-time overview of the project state and team activity. Switchable blocks let you easily customize the view to highlight details most relevant to your workflow. This flexibility helps your team focus.
Step 2: Project Key Indicators
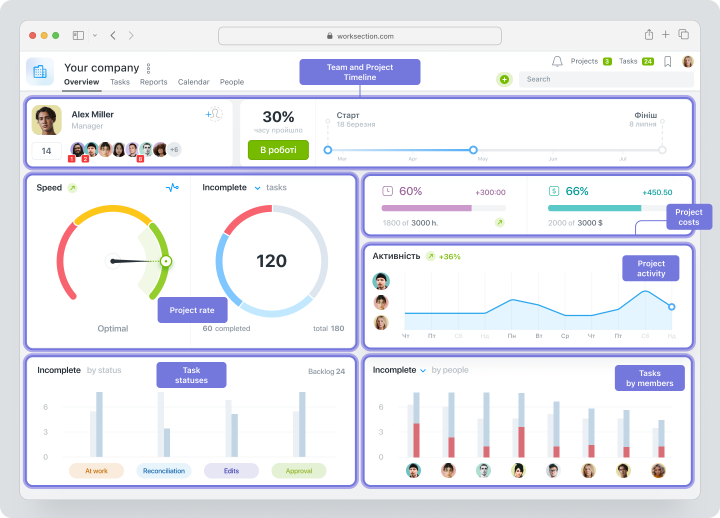
The dashboard helps your team stay informed by providing key metrics that are easy to track and analyze. It automatically compiles important statistics, giving you a clear picture of your project’s progress:
- Monitor task completion rates and deadlines.
- Assess team engagement and workload distribution.
- Keep track of financial and non-financial costs.
Step 3: Collaboration and Sharing Options
The dashboard is available to all project participants. This makes it easy for everyone to stay in sync and access the latest updates. The dashboard can also be exported or printed. This is a handy tool for sharing updates during face-to-face meetings or virtual discussions.
Quick Summary Table of Worksection Dashboard
| Feature | Benefit |
| Switchable Blocks | Customize your view by focusing on the data that matters most to your team. |
Project Progress Indicators | Easy deadline tracking, workload monitoring and resource usage management. |
| Financial and Non-Financial Costs | Simplifies budget project management and resource allocation. |
| Statistics Compilation | Quickly access compiled insights for presentations or team discussions. |
| Export and Print Options | Makes it easy to present updates during meetings or share externally. |
Pros and Cons of Worksection Dashboards
| Pros | Cons |
| No need to set up. | Limited advanced customization use compared to competitors. |
Customizable blocks for tailored views. | May not be well suited to managing complex tech projects. |
| Tracks key indicators like progress and costs. | |
| Accessible to all project participants. | |
| Easy-to-use interface for real-time updates. |
Worksection dashboards provide a simple and effective way to track project progress, team activity and resource allocation in real time. You can focus on the details that matter most to your workflow with a customizable block view. However, some users may find the advanced tools lacking, especially for more complex technical projects.
How to Create a Dashboard in Jira
Dashboard in Jira is a main display you see when log into your account. They are highly customizable and help keeping project implementation on track. Here’s a detailed guide to creating, customizing, and sharing dashboards in Jira:
Step 1: Setting Up Your Dashboard in Jira
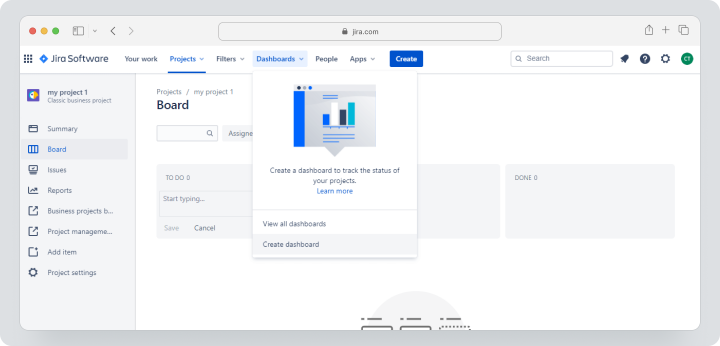
- Log in to Jira and go to the “Dashboards” menu in the top navigation bar.
- Select the “Create Dashboard” option.
- Enter a name and description for the dashboard.
- Click “Create” to finalize your dashboard’s basic structure.
Step 2: Adding Gadgets and Customizing Widgets
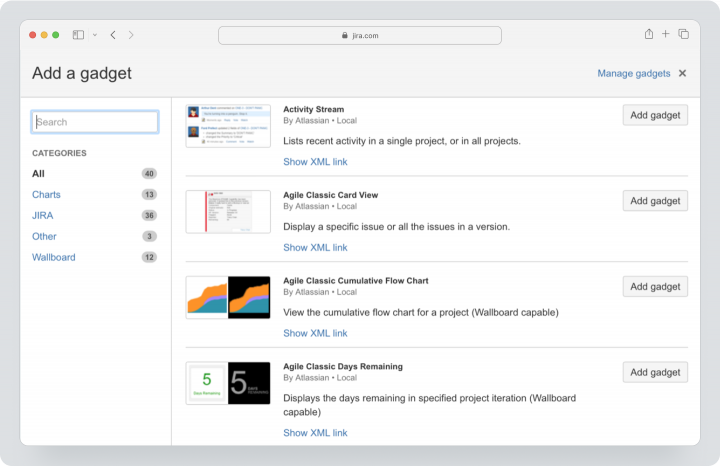
- Open the newly created dashboard and click on “Add Gadget.”
- Browse through Jira’s extensive gadget library, including options like Sprint Burndown, Assigned Issues, and Project Progress.
- Select gadgets relevant to your team’s workflow, and configure them by applying filters or project-specific settings.
- Adjust the layout by dragging and resizing widgets for optimal organization.
Step 3: Sharing Your Dashboard in Jira
- Go to the dashboard settings and select the “Share Dashboard” option.
- Specify the users, groups, or roles that can view or edit the dashboard.
- Save your sharing preferences, ensuring company members have the right level of access.
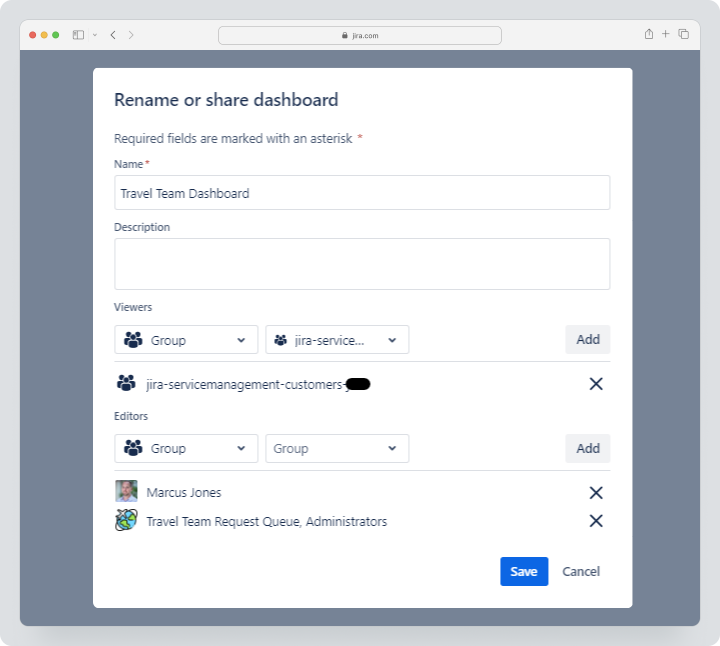
The table below highlights the progression of dashboard creation:
| Step | Feature Added |
Step 1 | Dashboard creation |
| Step 2 | Widgets and gadgets customization |
| Step 3 | Collaboration and sharing |
Pros and Cons of Jira Dashboards
| Pros | Cons |
| Highly customizable for Agile and technical teams. | Steep learning curve for non-technical users. |
| Extensive library of gadgets and integrations. | The price can be too high for small teams or startups. |
| Robust permission and sharing settings. | |
| Ideal for project management of sprints and complex workflows. |
Jira dashboards are very flexible and functional, especially for teams managing technical workflows. They are a powerful tool for visualizing complex project data due to their ability to integrate different gadgets and provide permission settings. However, for users unfamiliar with technical tools, the extensive feature set, and advanced customization options can be overwhelming.
How to Create a Dashboard in Notion
Notion is a highly flexible tool that allows users to create personalized dashboards for project management, tracking tasks or creative planning. You can create a dashboard that fits your workflow with its block-based design and intuitive interface. Here’s a step-by-step guide:
Step 1: Creating a New Page and Adding Views
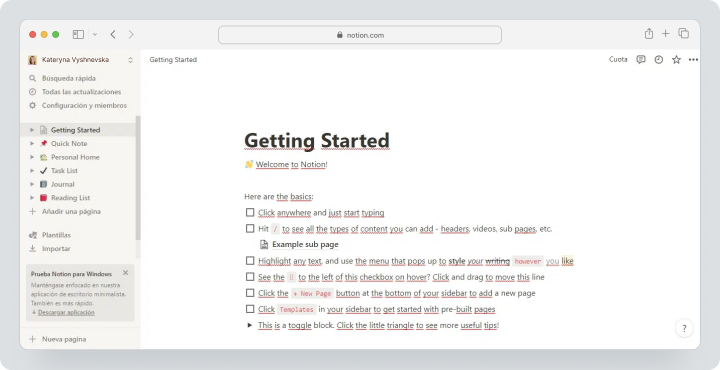
- Log in to Notion and navigate to your workspace.
- Click the “+ New Page” option in the sidebar to create a new page.
- Name your page and set its purpose (e.g., project management or progress tracking).
- Add database views such as “List,” “Table,” “Calendar,” or “Board.” These views will form the backbone of your dashboard.
- Use drag-and-drop functionality to arrange these views into your desired layout.
Step 2: Customizing Tables, Boards, and Embedding Tools
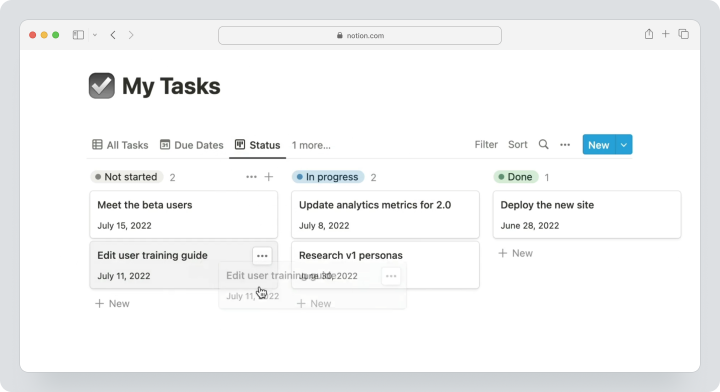
- Fill your tables and boards with relevant data, such as tasks, deadlines, and priorities.
- Add columns for tracking task progress, team assignments, or custom labels.
- Embed external tools like Google Calendar, Figma designs, or YouTube videos using the “/embed” command for additional functionality.
- Apply filters and sorting options to ensure the data is organized for easy reference.
Step 3: Organizing and Styling Your Notion Dashboard
- Use headers and dividers to categorize sections for better readability.
- Customize the page style with icons, cover images, and color-coded tags to make it visually engaging.
- Reorganize blocks and widgets as needed to keep your dashboard intuitive and functional.
- Regularly update the dashboard to reflect the latest project information.
The following table highlights the key steps of dashboard creation in Notion:
| Step | Feature Added |
| Step 1 | Basic framework and views created. |
| Step 2 | Custom data and embedded tools. |
| Step 3 | Styling and organization applied. |
Pros and Cons of Notion Dashboards
| Pros | Cons |
| Highly customizable with a variety of views. | Setup can be time-consuming for beginners. |
| Allows seamless embedding of external tools. | Lacks advanced reporting and analytics. |
| Suitable for creative and visually engaging dashboards. | |
| Intuitive drag-and-drop functionality. |
Notion dashboards are flexible and intuitively designed. They allow users to create highly customized workspaces. However, they require effort and creativity to set up effectively, which can be time-consuming for new users.
How to Create a Dashboard on Monday.com
Monday.com provides easy-to-use dashboards that enable teams to track progress, visualize workflows, and project management efficiently. Follow these steps to create and customize a dashboard on Monday.com:
Step 1: Adding a Dashboard and Connecting Boards
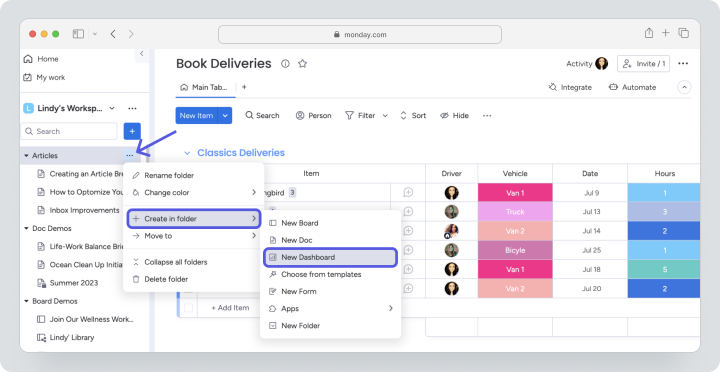
- Log in to Monday.com and click “+” in the left-hand menu.
- Then choose “New Dashboard”, give it a name that reflects its purpose.
- Pick a dashboard type. It can be main or private.
- Connect relevant boards to the dashboard by selecting them from your workspace. This links the data, ensuring real-time updates across all widgets.
Step 2: Adding and Customizing Widgets
- Open your new dashboard and click “Add Widget” to access Monday.com’s widget library.
- Choose widgets like Timeline, Workload, Calendar, or Chart to visualize project details.
- Customize each widget by selecting data fields, applying filters, and adjusting display options to suit your needs.
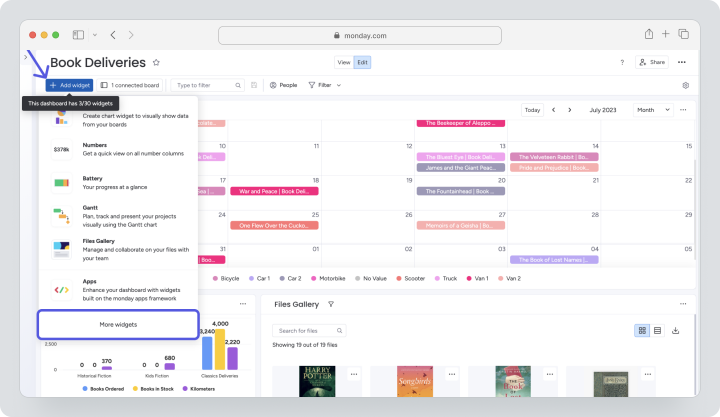
Let’s summarize the widgets and customization options available in Monday.com:
| Widget | Customization Options |
| Timeline Widget | Tracks project schedules and deadlines |
| Workload Widget | Monitors team capacity and tasks |
| Chart Widget | Visualizes data in bar, pie, or line charts |
| Calendar Widget | Displays deadlines and schedules |
Step 3: Sharing Your Dashboard on Monday.com
- Click on the ‘Share’ button in the Dashboard settings to grant access to your teammates.
- Enter your teammate’s name and select them from the list.
- Save your sharing preferences to finalize your access settings.
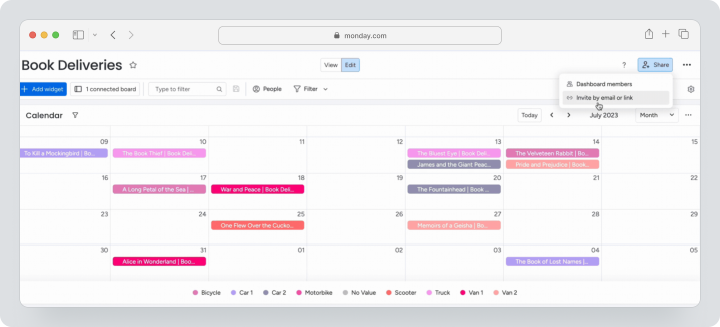
Here’s a table that summarizes all the steps:
| Step | Feature Added |
| Step 1 | Framework creation and workplace board connection |
| Step 2 | Data visualized through Timeline, Workload, and more |
| Step 3 | Collaboration and access settings enabled |
Pros and Cons of Monday.com Dashboards
| Pros | Cons |
| Bright, visually engaging interface. | May not suit teams with highly complex workflows. |
| Quick setup with pre-designed templates. | Pricing escalates significantly for larger teams. |
| Wide variety of widgets for data visualization. | |
| Excellent for collaborative, real-time updates. |
Monday.com dashboards are visually appealing and easy to set up, making them an excellent choice for teams that prioritize user-friendly interfaces and vibrant visuals. However, the platform may fall short for teams needing in-depth reporting or advanced customization options.
Comparing Dashboard Features in Worksection Jira, Notion, and Monday
Choosing the right system for your dashboard depends on factors like usability, customization, integrations, and collaboration features. Jira, Notion, Monday, and Worksection each bring unique strengths and limitations to the table, catering to various user needs.
Ease of Use and Customization Options
- Worksection: Combines ease-of-use with the presentation of key metrics, allowing teams to use the dashboard at every step of a project, tailored to their workflow.
- Jira: Jira offers advanced customization options. However, the system has a steep learning curve, making it less accessible to beginners.
- Notion: Extremely user-friendly with drag-and-drop functionality, Notion provides unparalleled customization for dashboards tailored to individual preferences.
- Monday: Bright and intuitive, Monday excels in user experience with pre-designed templates and widgets but offers less flexibility than Notion.
Available Integrations and Widgets
- Worksection: Focuses on essential widgets that reflect key project indicators such as project progress, team engagement, performance statistics.
- Jira: Extensive integrations with third-party apps, ideal for software development workflows. A wide library of widgets supports detailed project management.
- Notion: Relies heavily on third-party embeds for functionality but offers seamless integration for tools like Google Calendar and Figma.
- Monday: Provides numerous built-in widgets like Timelines and Workloads but offers fewer external integrations than Jira or Notion.
Collaboration and Sharing Capabilities
- Worksection: The dashboard is a main project view that is accessible to everyone involved in the project. It helps to collaborate effectively during the work process.
- Jira: Excellent for team collaboration, with robust access controls and issue tracking.
- Notion: Supports real-time collaboration, but lacks granular permission settings.
- Monday: Emphasizes team visibility with shared dashboards and easy task assignment.
Reporting and Analytics
- Worksection: Offers built-in reporting tools, including expense tracking and time analysis.
- Jira: Advanced analytics tools for tracking sprints and project management metrics.
- Notion: Limited native reporting; relies on manual setup for data visualization.
- Monday: Basic reporting features through widgets like charts and tables.
Limitations in Each Platform
- Worksection: Focused on core features, with fewer advanced integrations.
- Jira: Complex for new users and costly for smaller teams.
- Notion: Lacks advanced native features for project tracking.
- Monday: Limited customization options compared to competitors.
Why Worksection is the Best Option for Working with Dashboards
Worksection’s Dashboard is the ideal choice for teams of all sizes. Worksection provides an easy-to-use, integrated solution that helps teams stay organized, track progress and make data-driven decisions with ease.Unique Advantages of Worksection Dashboards
Intuitive and Collaborative Design
Worksection dashboards are easy to use and accessible to all project participants, ensuring that everyone stays informed and aligned. The simple layout means there is no need for extensive training. Teams can get up and running quickly and focus on what matters. Built-in sharing features make collaboration during meetings or presentations seamless.
Customizable Blocks for Tailored Insights
You can customize dashboards to show only the data that’s most relevant to you. By toggling and customizing blocks, teams can create a clear and personalized view of their workflow. This allows them to focus on priorities without unnecessary distractions.
Comprehensive Reporting Tools
Worksection dashboards provide tracking metrics for both financial and non-financial aspects of project management. With tools to monitor task progress, assess team engagement and control costs, you gain actionable insights that help improve decision-making and save valuable time.
Seamless Integration with Team Workflows
To ensure nothing slips through the cracks, the dashboard acts as a central hub, providing real-time updates on tasks and resources. Project overviews and reporting statistics are available in Worksection, aiding execution control.
Final Thoughts: Choosing the Right Dashboard Tool for Your Needs
Selecting the right dashboard tool depends on your team’s specific needs and workflow requirements. Jira is a strong choice for technical teams managing complex Agile workflows, offering advanced customization and powerful integrations. Notion excels for creatives and small teams seeking maximum flexibility and design freedom, while Monday shines with its visually engaging dashboards and collaborative features.
Worksection stands out for its ease of use, flexibility, and robust collaboration features, making it ideal for teams seeking a comprehensive, user-friendly solution. Its customizable blocks, real-time progress tracking, and versatile reporting options make it a top choice for many.
However, other tools might be more suitable for teams with highly specialized requirements or advanced reporting needs. It’s important to evaluate the specific needs of your projects and team dynamics to find the perfect fit. For most teams, Worksection offers the perfect balance of simplicity and power, ensuring smooth collaboration and efficient project management.