Planning improvements
Gantt diagram
Now you can see and edit your estimates1
If you don’t have any estimates yet, you can create them quickly by clicking on Plan2

Task Cost Planning
Whenever you are planning a task budget, you can visualize its correlation to the project’s budget. It helps to understand what resources have been used and what you still have remaining.
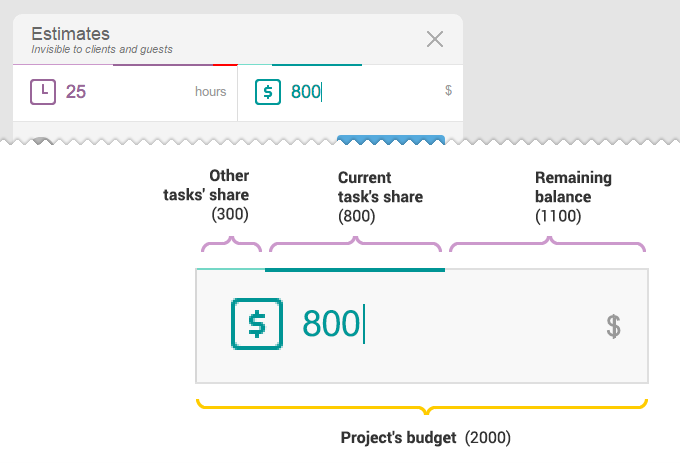
The status bar will turn red if the amount is outside the limits.
You can get more information by clicking the mouse at the upper corner of the form.
You can get more information by clicking the mouse at the upper corner of the form.
Reports
This is how the Report tab looks now:
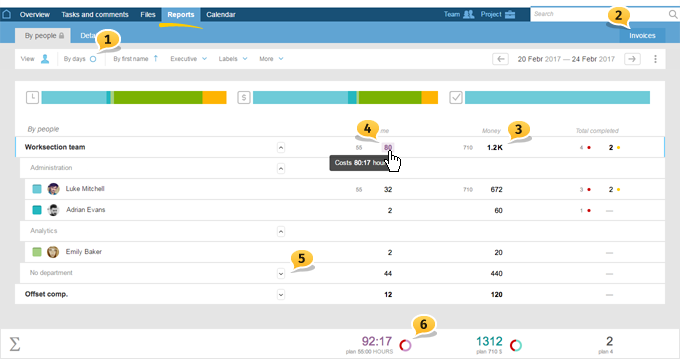
1 «Daily» tab was dropped. This view now is simply displayed on the panel.
2 «Invoices» tab is located on the right.
3 You can sort users by a company and a department with the displayed amount.
4 Hovering the cursor over the number will show the exact value, but when you click on it, the Detailed Report will pop up.
5 All the companies and departments’ tabs are initially minimized. With the help of the familiar checkmark icon, the selection can be expanded. The state is remembered, and you don’t have to reconfigure it every time.
6 We added charts so you can visualize the comparison of Plan and Actual over the certain time (will appear only in View> Plan and Actual).
NEW Plan and Actual
In the «View» new option was added: Plan and Actual / Only Actual. That’s what it looks like:
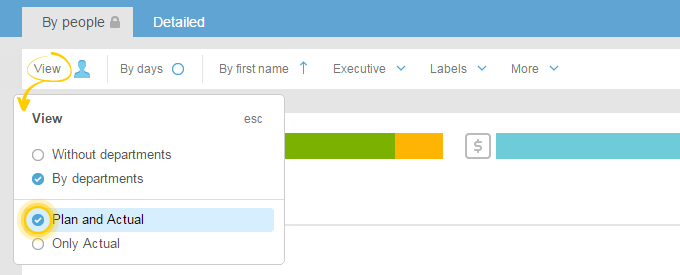
Only Actual — something you are already used to. The report consists of closed tasks and tasks with reported costs. Keep in mind that if for some reasons a task was not closed, it is considered unfinished. The report will not show it.
Plan and Actual new — in this case, a report will show closed and unfinished projects within the selected timeframe. The report would also contain estimates (in additional columns), which will sum up on the bottom panel.
Attention! Everything you see on the screen goes to XLS when exported. That is why when you have View Plan and Actual opened — an exporting report will include actual and new columns with estimates.
Executive upd

In the search area, you can find not only a specific person but also a department or a company as well.
Let’s look at some examples:
Report/ Search by name
Report/ Search by name
That is how the fist page looks like when you enter the Reports tab:
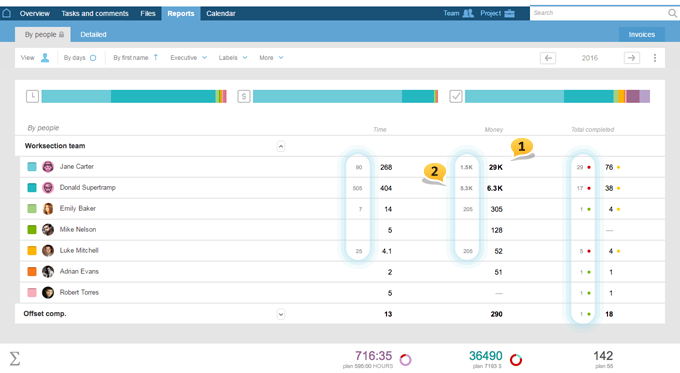
You are now able to analyze not just actual1 but estimates at the same time. Click View
> Plan and Actual and the estimates’ values will show up in separate columns2.
We deleted the columns marked as hot tasks. Instead, we added indicators that let you analyze the current situation and the productivity of your team in greater details:
 — hot tasks that are planned but not completed
 — tasks completed on time
 — some of the tasks were completed but with
If you want to find out the meaning of the specific number — click on it to get transferred to the Detailed Report, where every single number will be broken down in more details.
Report/ By Days
From now on, it is not a separate tab but a switch that is located on the right by the View button.
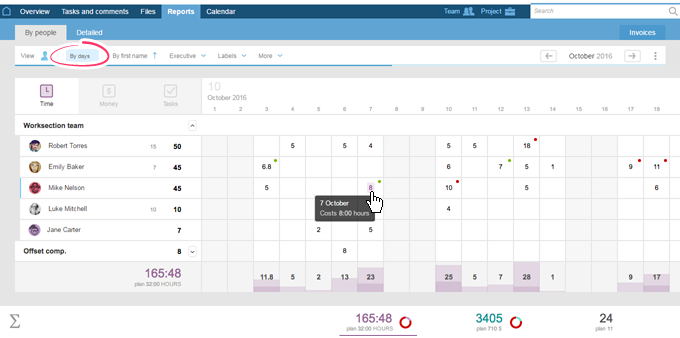
By people > By days > Time — added indicators that allow you to navigate faster «on the spot»:
 — a person works over 8 hours a day (overloaded or made a mistake)
 — a person works 6,5-8 hours a day (optimal workload)
Attention! Whenever the Time Report gets too long and does not fit the screen, move the cursor on the calendar the same way you drag it over on the Gantt chart.
Report/ Detailed
It used to be called By tasks...However, not just the name has changed.
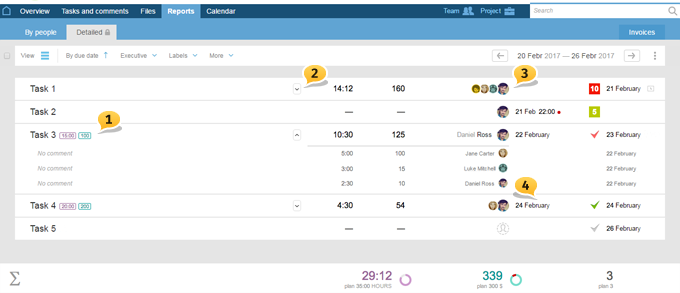
1 Planned costs are listed next to the name and are quickly edited.
2 Details of the cost can be minimized and expanded separately.
3 You will be able to see all the people with their costs. Click on the profile to see more details.
4 The separate column Date By is an addition to our existing Actual Date. That makes the report easier to understand.
So, let’s find out what is in our report from 20th till 26th of this month and why:
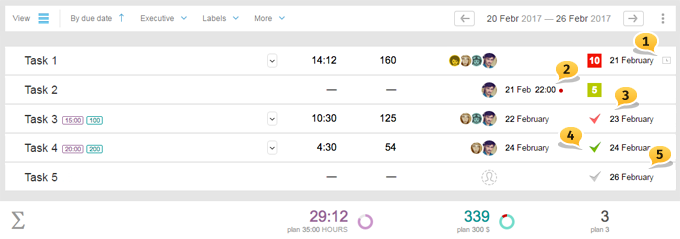
Task 1 — Is open (you can see it’s tagged as a priority) and is in the report due to the 21 Feb’s new costs (the related icon next to the date can be seen in the right column)1.
Task 2 — Is still open (tagged as a priority) and is shown in the report because it is supposed to be closed on Feb 21 at 22:00 (the date is shown in the separate column with the red indicator2).
Attention! When you are in Only Actual view, you will not see this particular type of tasks as well as the previous type. They are not included in the report.
Task 3 —is in the report because it was closed on Feb 23 (in Actual Closing date column3). However, the task was late (you can see the red indicator) and the Date By was Feb 22d (see the date in a separate column).
Task 4 — In the report, because it was closed on Feb 24th and was completed on time (green checkmark4).
Task 5 —Unscheduled task. It is in the report because it was closed on Feb 265. This task does not have a specified time limit (the Date column was empty), that is why checkmark is gray.
Attention! During the extended tasks, the comparison value of Estimates and Costs over the short period of time might be approximate. The best way to get more precise results is to extend the time frame. It happens because Estimates are not spread out along the full length of a task (3 months, for example). So they are always registered in a report on a final day. You won’t have any problems and always get the precise results when working with everyday tasks.
Let’s finish with project’s reports and jump to the account in general.
Here you can find a new type of reports. It turned out to be so useful that we decided to make it "launched."The other tabs got updates as well. They have nicer and easier to understand look, just like the newly introduced Reports inside the project ;-)
Report / General new
The general report helps to indicate how much each member contributes to the team in each project. The report represents a table in which each line of projects come across with the column of members. In each cell, you can see Planned (small and in the corner) and Actual Costs (large and centered).
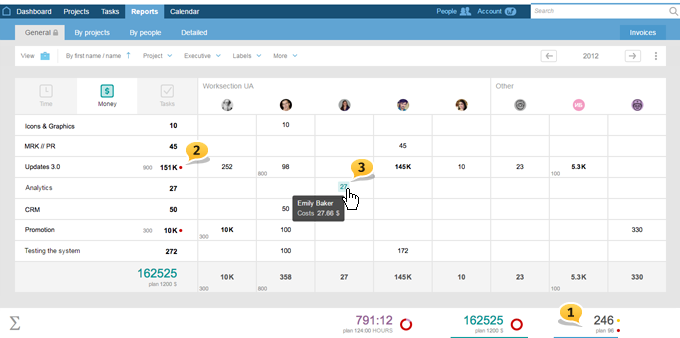
1 — You can switch among Time/ Money/ Tasks on the top and the bottom of the page.
2 — Red indicator lets you know that the value is exceeded.
3 — Place the cursor on any number and you will find out the exact values. Click on the same number, and you jump to Detailed Report, where you would see how certain numbers are broken down.
Miscellaneous
Inserting # projects’ tasks into the text
Now you can insert the link nicely in any comment of a specific task or inside the description of the another task. Use # symbol for this purpose the same way you use @ whenever you need to mention a team member.
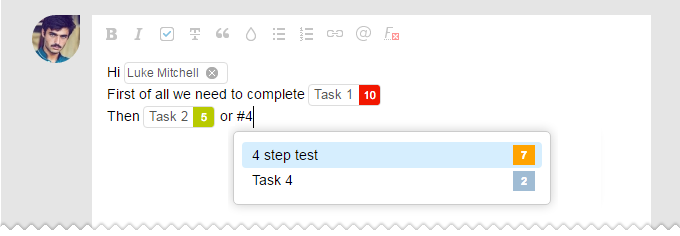
Inserts such as #task and @mention can work now in instant messaging.
Flexible Daily Digest
In the settings of Daily morning digest, you can find a button slider:

Now you can get task reports according to Executive, Author or executive, or Subscriber.
Dear friends, that is it for today. As always,
we cannot wait to hear your comments and new offers.
Have a productive
Worksection Team
