When a project is just starting, there are not many tasks — a regular list is enough. But over time, they increase: subtasks are added, dependencies appear, priorities change. And at some point, the list stops answering simple questions: what is currently being worked on, where the delay is, and whether we are meeting the deadline.
In such situations, teams usually switch to Kanban or Gantt charts. One helps to see the process in motion, the other keeps deadlines and dependencies in check.
In Worksection 2.0, we didn’t change the approach to these tools — they remain familiar. But we made it easier to work with them daily: fewer unnecessary actions, faster updates, more convenient navigation. We explain how this feels in practice.
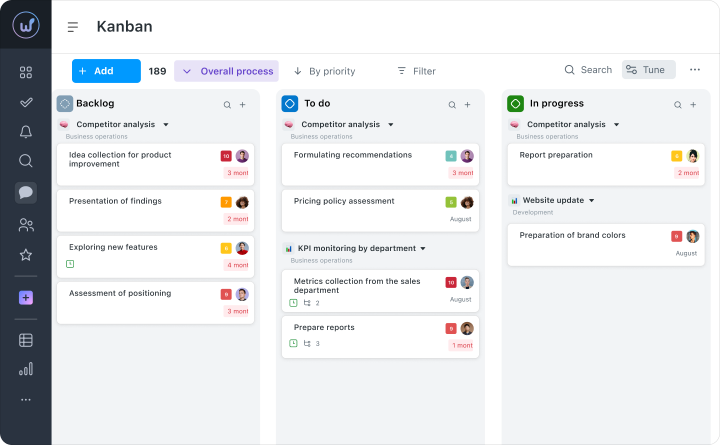
Kanban in Worksection 2.0
When tasks pile up, statuses quickly become outdated. Some things are already done, but still show as “in progress,” and some are stalled — but this is not immediately obvious. As a result, it’s difficult to understand what is really happening in the project right now.
The Kanban board solves this simply: each task is at its own stage, and the entire process is visible at a glance. Where work is progressing and where it has stalled is clear without additional checks.
In Worksection 2.0, Kanban remains familiar, but it has become faster and more convenient to use in daily scenarios.
Kanban boards are available in Worksection 2.0 on all plans. Personal Kanban — in Basic, by days — in the Business plan, project Kanban — only on Premium.
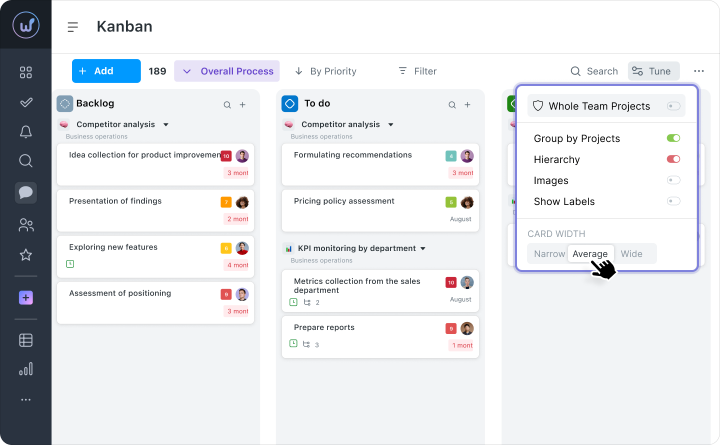
Less Visual Noise
We updated the design of the Kanban board — it is now easier to read, even with many tasks. Cards do not merge into a solid list, and statuses are visible at first glance.
As a result, the team navigates the process faster, and the manager doesn’t have to “figure out” what is happening — the overall picture is clear immediately.
Flexible Columns
The width of the columns can be adjusted to suit you. For example, expand the stage where there are currently the most tasks, and narrow those that are barely used.
This makes it easier to keep in sight what is currently happening, rather than scrolling through the board in search of the needed tasks.
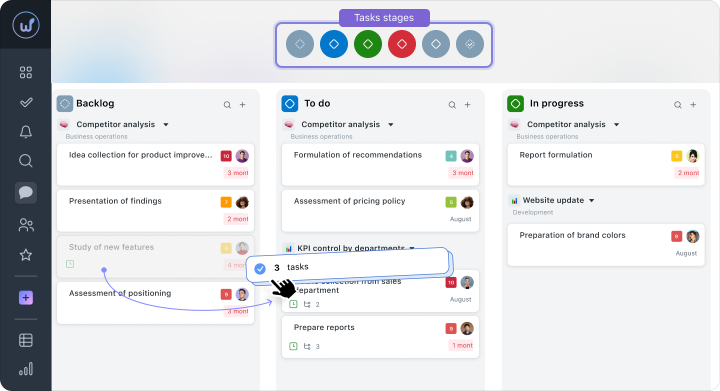
Quick Search through the Backlog
The search works not only by title but also by descriptions, tags, and assignees. You don’t need to enter an exact query — just part of a word, and the system immediately finds the needed card. The found task can be dragged into the desired column right away without any extra actions.Grouping Cards by Hierarchy
All subtasks and nested levels are automatically displayed under the main task. They can be collapsed or expanded depending on how detailed you need to go into the task — from the big picture to small steps. During work, you can move either individual subtasks or the entire group at once. This simplifies planning of large tasks and working with multi-level projects.
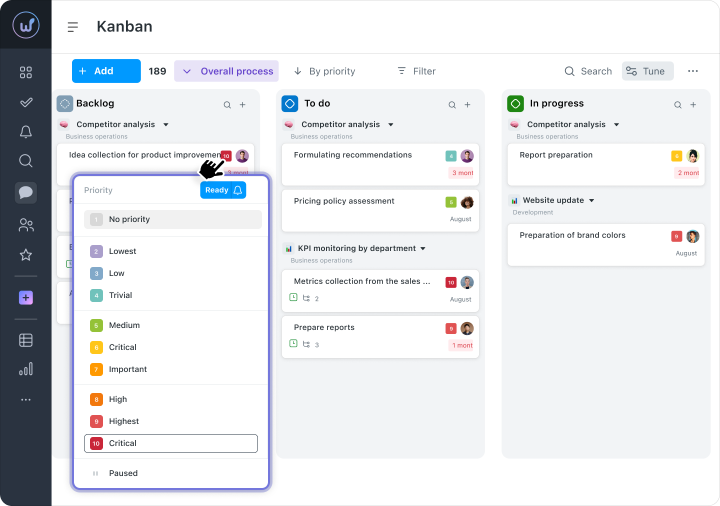
Mass Operations with Tasks
You can select several cards and change them at once: statuses, assignees, or deadlines. Tasks can also be copied, moved between columns, or deleted. With Drag&Drop and working with groups of tasks, updating a large volume of work at once is easy — for example, after a meeting or when priorities in the project change.
Instant Editing Right on the Board
Executors, deadlines, and priorities can be changed directly on the board — without opening each task separately. All changes are saved automatically, and the board updates immediately, without refreshing the page.
Essentially, Kanban provides what is often missing in standard task lists — visibility of the process. You can see not just a list of work, but also at what stage each task currently is.
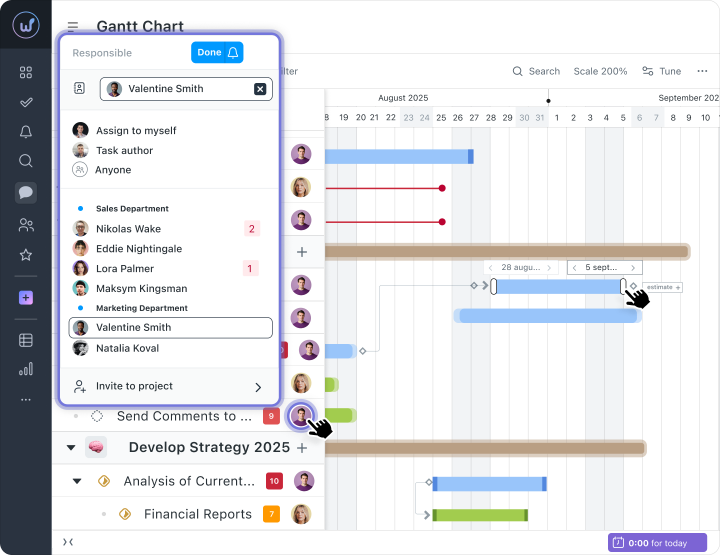
Gantt Chart in Worksection 2.0
When tasks depend on each other, any change affects the entire plan. If a deadline is postponed — other tasks shift as well. Someone hasn’t started working because they are waiting for the results of the previous stage. In a list, this is not always noticeable.
The Gantt chart gathers all these connections into a unified picture: deadlines, dependencies, and assignees. This helps to immediately understand how realistic the plan is and where risks may arise.
In Worksection 2.0, the logic of the chart remains familiar, but it has become easier to work with — data updates faster, and it’s easier to keep focus and not lose the context of the project.
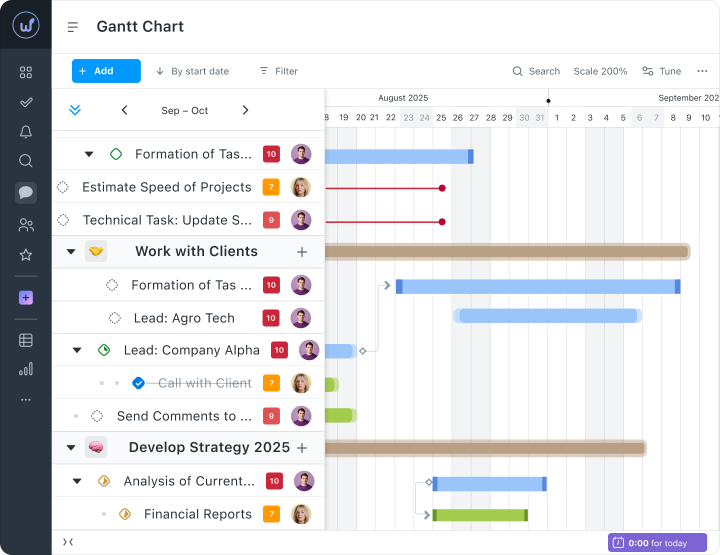
Structured Design
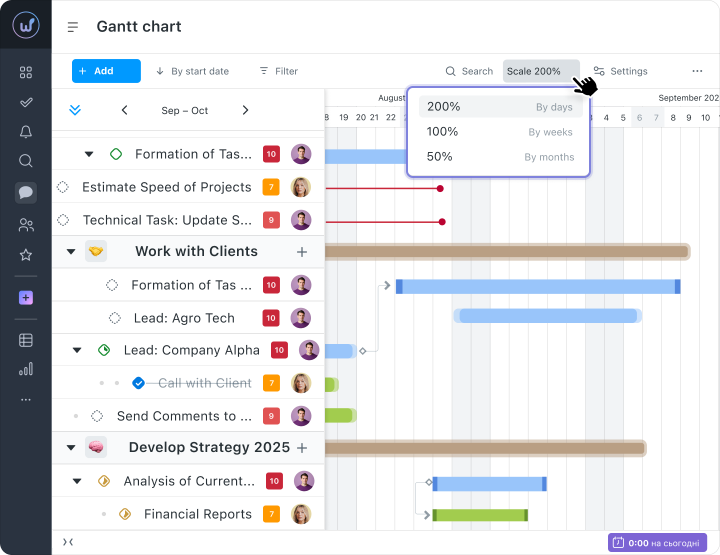
The updated Gantt chart interface has become simpler and easier to perceive. Key stages, events, and deadlines are now read faster thanks to a clear visual structure and an understandable system of markings. Flexible scaling (days, weeks, months) allows for comfortable use with both small plans and large projects.
Instant Task Updates
Deadlines, executors, statuses, and dependencies synchronize in real-time. The chart always reflects the actual state of the project without needing to refresh the page. This is especially convenient for teams working in parallel: just change the execution term or another parameter — and the whole team sees the update immediately.
Gantt Chart at the Project and Account Level
The chart is available at both the level of an individual project and across the entire account. This allows the manager to switch between detail and the big picture: analyze one project or control the status of all initiatives at once.
Extended Planning Horizon
Planning covers both future periods for years ahead and the history of completed tasks. This is especially useful for long-term projects: you can evaluate progress dynamically, track changes, and analyze team results.
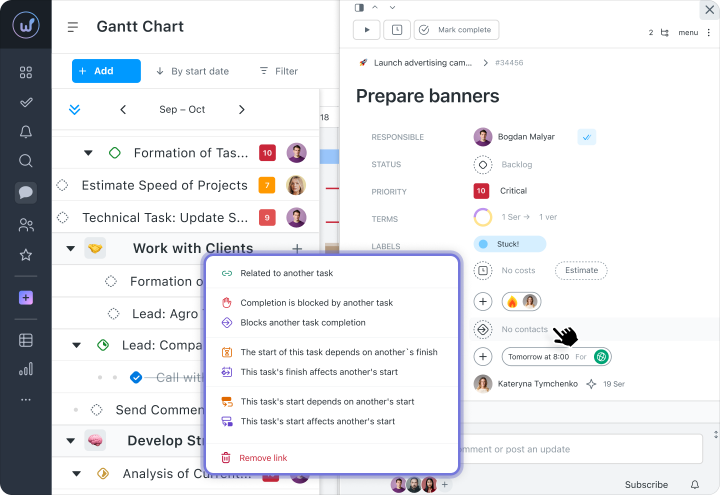
Working with Task Dependencies
Dependencies between tasks are displayed on the Gantt chart, helping to plan the sequence of execution:
- Finish-Start— task B starts after the completion of task A. Classic for sequential work.
- Start-Start — tasks start simultaneously. Used for parallel execution of related tasks.
- Finish — Finish — tasks are completed simultaneously. Suitable when the results need to be ready by the same deadline.
Separately available are:
— blocking dependencies, where one task blocks or depends on another;
— informational dependencies, which do not affect deadlines but show the logical relationship between tasks.
They are configured in the task view in the “Dependencies” section.
Visualization of Overdue Tasks
Overdue tasks are highlighted with a red line, which remains until closed or deadline is postponed. This helps to quickly notice problem areas in the plan and respond to delays without additional analysis.
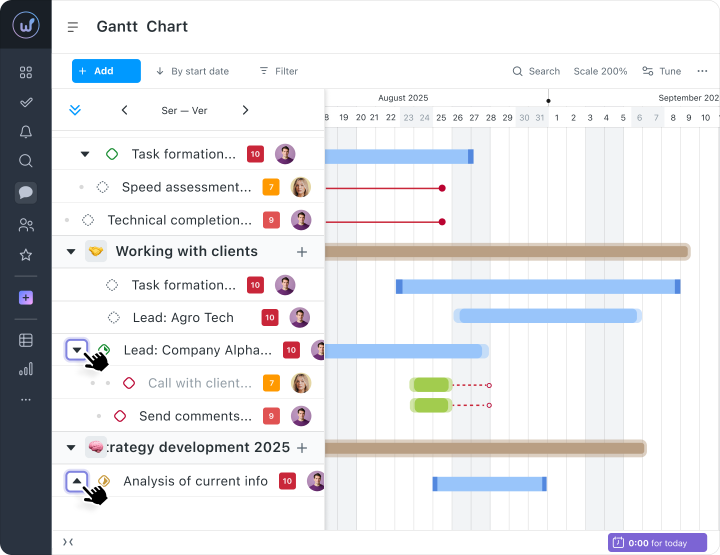
Hierarchy of Subtasks
Tasks and subtasks can be expanded or collapsed with a single click. This allows switching between detail and the big picture. For example, a manager can focus on project stages, while an executor works with specific subtasks in their block. This makes the chart suitable for both strategic planning and the daily work of the team.
Fixed Top Panel
The top panel of the chart remains in place when scrolling through large projects — navigation and the timeline are always in view. This simplifies navigation through the plan and helps work quickly with long timelines without losing context.
Instant Editing Right on the Timeline
Deadlines, executors, and priorities can be changed directly on the timeline — without opening a separate task card. This speeds up updating the plan, especially after meetings or changes in project priorities.
Try Worksection 2.0 for free for 14 days via this link 
What It Gives to the Team
When many tasks are being worked on simultaneously, it is important to understand two things: what is happening now and whether the plan is being maintained in the future.
Kanban helps to see the current state of work — exactly where the tasks are and what is in process. The Gantt chart — to control deadlines and dependencies among tasks.
As a result, the team spends less time clarifying statuses: the manager sees the overall picture immediately, and the executors understand the priorities and relationships between tasks.
And due to quick editing, mass actions, and instant updates, less time is spent working with the system — and more is left for tasks.
Kanban and Gantt Chart — Part of Worksection 2.0
These tools do not exist separately — they work together with other features of Worksection 2.0: dashboards, daily plans, saved display modes, andbuilt-inchats.
As a result, there’s no need to switch between sections or gather information manually. All work on the project — tasks, statuses, and communication — is in a single workspace.
Everyone can customize it for themselves: a dashboard with key indicators, a task list with filters, or a daily plan with workload. Meanwhile, the project structure remains common for the entire team.
Worksection 2.0 does not change processes — it makes them simpler and clearer for the entire team.