Timer
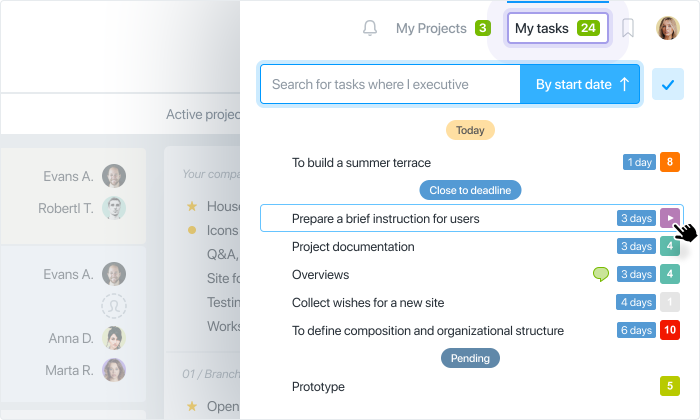
The system has a built-in timer for controlling time spent by employees on tasks and calculating financial costs, if you specify the time rate per employee.
You can start the timer directly in the task or through the personal menu "My tasks" by selecting the desired task and starting the timer.
Note. Timer can be run only on one task at a time.
If necessary, time can be entered manually.
The administrator can see the active timers of his employees.
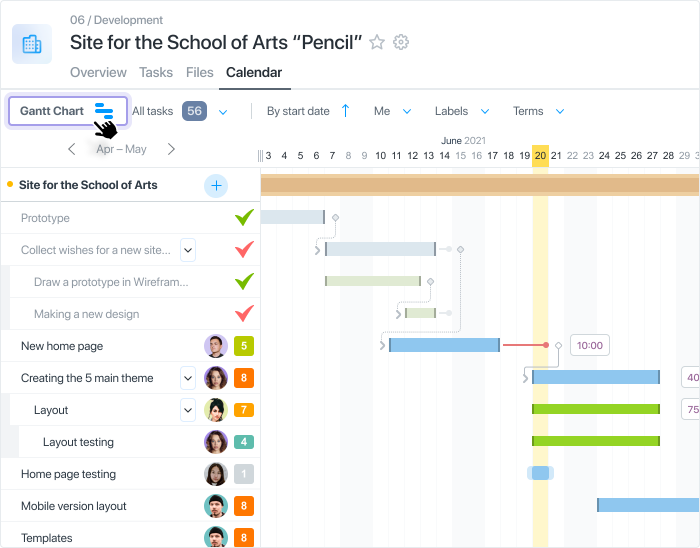
Gantt chart
This is a diagram that visually illustrates the project plan and allows you to easily control timing and relationships between tasks and their impact on the overall progress of the project.
You can easily export the chart to Excel if needed.
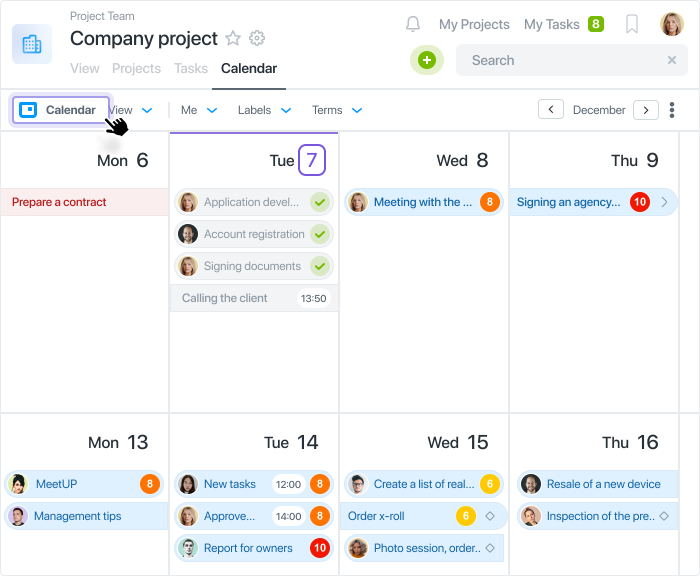
You can also view tasks in the team calendar or sync it with your personal Google or Apple calendar. So you will see the timing of tasks in the usual calendar format.
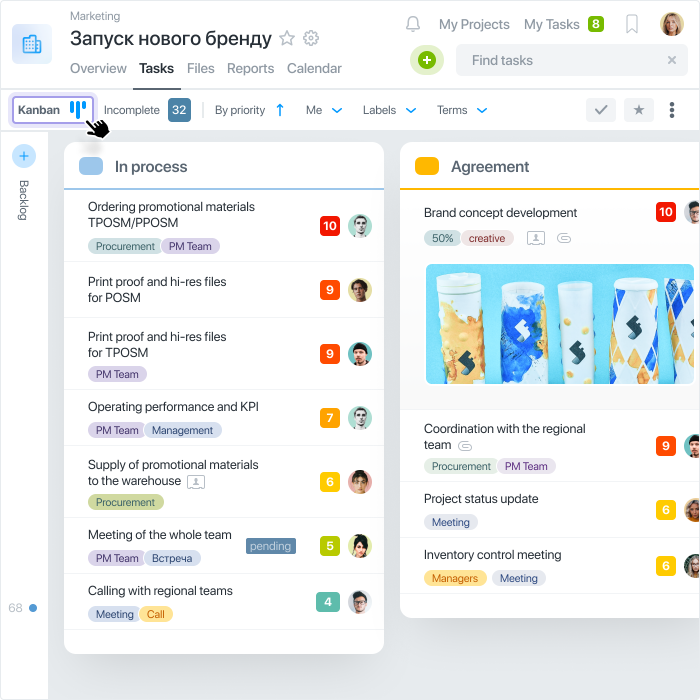
Kanban
This is the Agile method of visual control of tasks in the project. Kanban helps track the progress of tasks through the stages of the workflow (flow) to create a desired product.
In addition to the Gantt Chart and Kanban, Worksection can also display tasks in List or By People format.
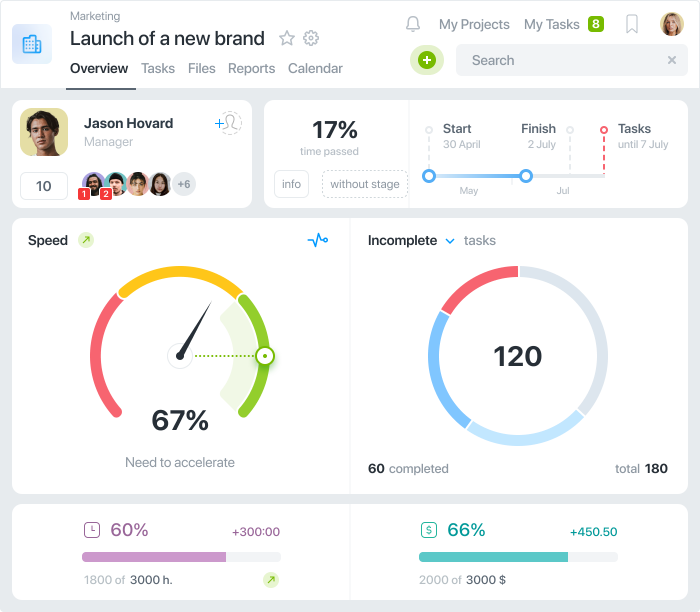
Dashboard project
The
Project dashboard helps quickly analyze the current state of a project with the help of various indicators. It is available for each project and is produced automatically according to the data that was initially planned in the project and the actual data on completed and closed tasks.