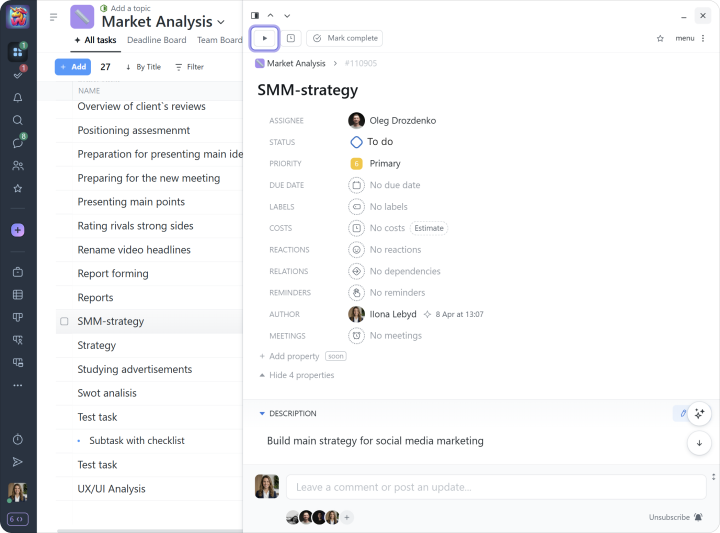
The system includes a built-in Timer for tracking employees’ time spent on tasks and calculating financial costs if an hourly rate is specified for the employee.
The Timer can be started directly in a task:
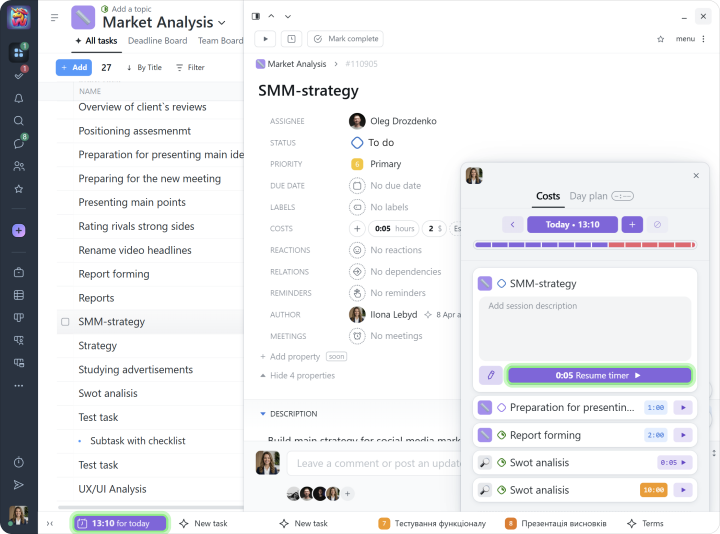
Or through the costs window in tasks where you have previously logged time:
Note The Timer can only be started for one task at a time.
If needed, time can also be entered manually.
An Administrator can see the active timers of their employees.
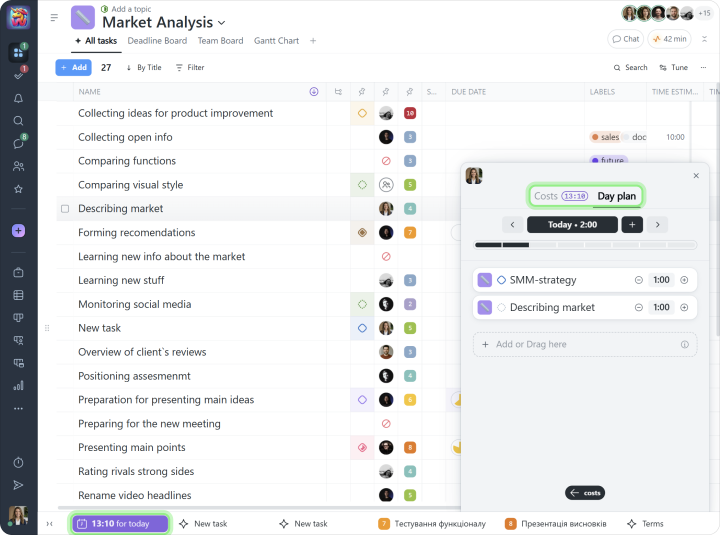
Day plan
This tool helps organize the working day. Add tasks and the time required to complete them, and the timeline will immediately show the day’s workload. This helps avoid overload and makes it easier to plan a realistic work schedule.
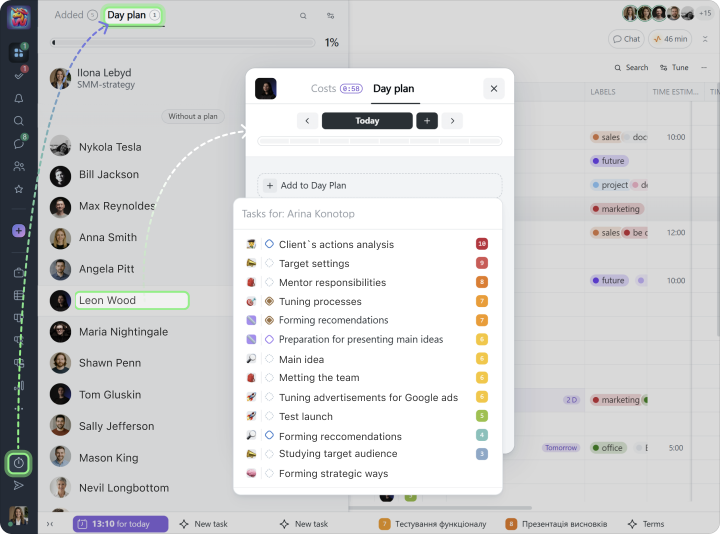
Use “Day plan” for team management.
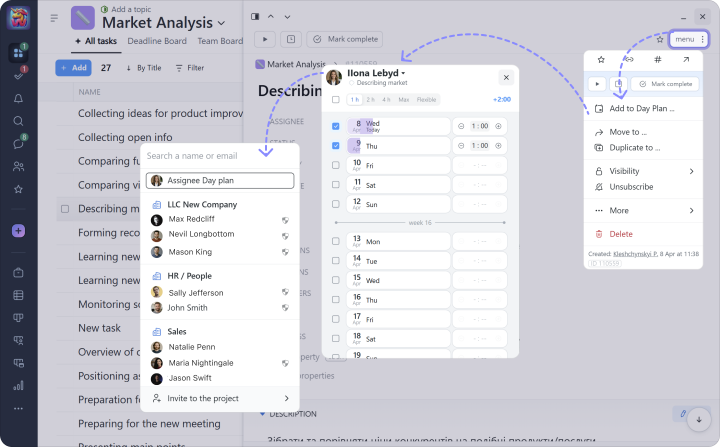
You can view employees’ tasks, see overloads or free time slots, and immediately add new tasks to their schedule. This helps you plan the team’s working time more effectively.
You can also add tasks to your employee’s “Day plan” directly from the task window:
Tray
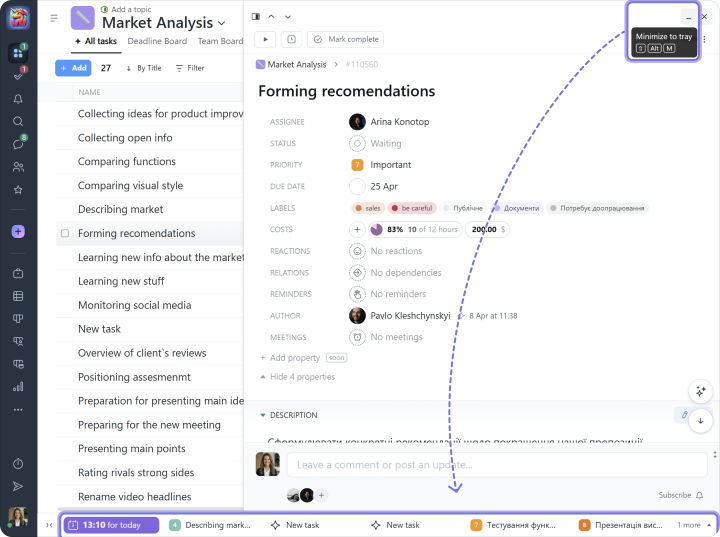
The tray in Worksection is displayed on all pages and appears at the bottom of each page as a bar. It is a convenient tool for quick access to your personal time log / day plan window, tasks, task drafts, chats, and the file pre-upload window.
Minimizing a task to the tray is simple: in the task window, click the minimize button, and the task will appear in the tray:
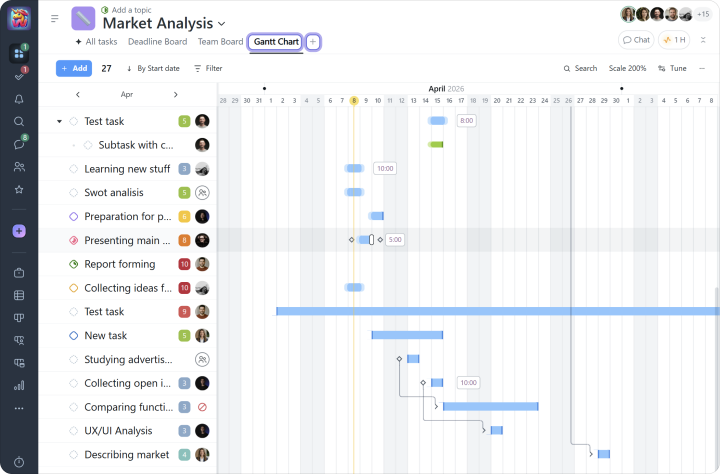
Gantt chart
This diagram visually illustrates the project plan and makes it easy to track deadlines, dependencies between tasks, and their impact on the overall progress of the project.
If needed, the chart can be easily exported to Excel.
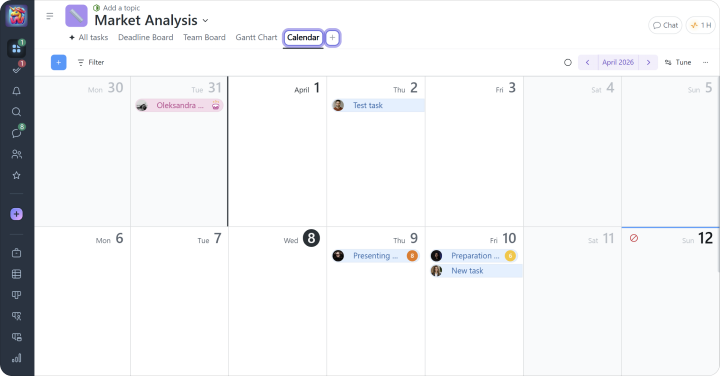
Tasks can also be viewed in the team calendar or synchronized with a personal Google or Apple calendar. This allows you to see task deadlines in a familiar calendar format.
The calendar also displays your colleagues’ birthdays, vacations, and sick leaves.
Note The calendar and Gantt chart can be viewed both within individual projects and across the entire account.
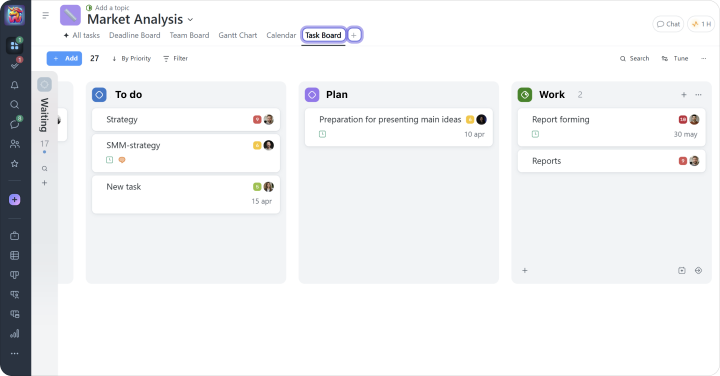
Kanban
This is an Agile tool for visually tracking tasks and the overall project. Kanban helps monitor how tasks move through workflow stages to deliver the required product.
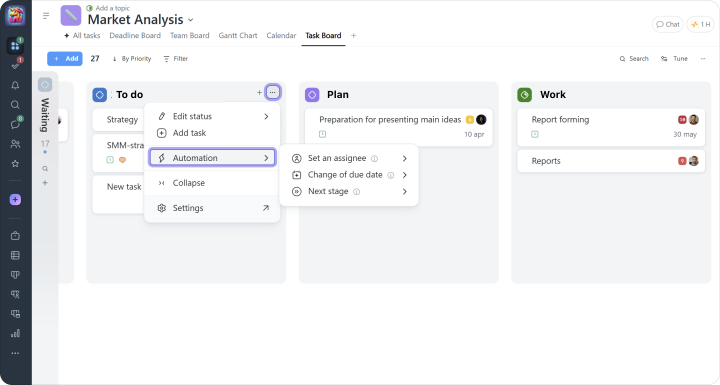
You can configure automations for each Kanban column:
Set assignee — lets you choose the employee who will be automatically assigned as the assignee when a task receives the selected status.
Change off due date — when a task receives a status, it can automatically get a new deadline.
Next stage — after configuring this automation, when a task is completed, the system will suggest moving it to the next status.
Note Kanban pages can be viewed both within a single project and across all account projects, but automations can only be configured within an individual project.
In addition to the Gantt chart and Kanban, Worksection can also display tasks in List, Kanban by People, Kanban by Days, and Gantt chart by People formats.
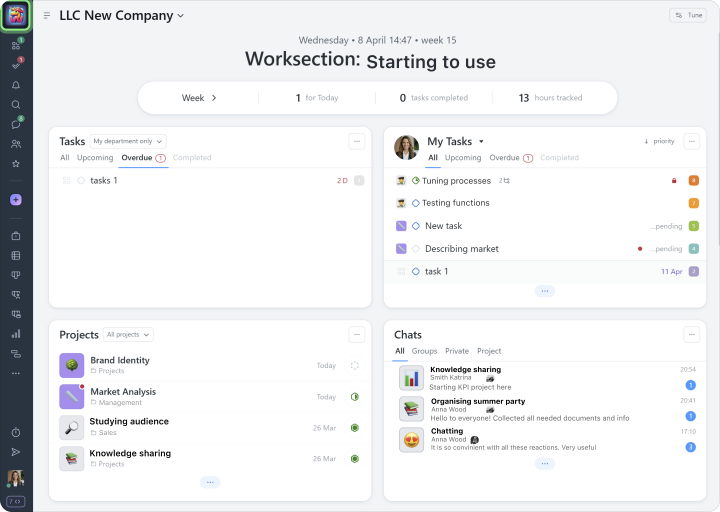
Dashboards
Account dashboard is the control center: it shows the status of work, progress, and team activity. Its widgets bring together key metrics and lists such as tasks, projects, people, events, and chats, with filters and links to details, so you can instantly see what is happening and take action.
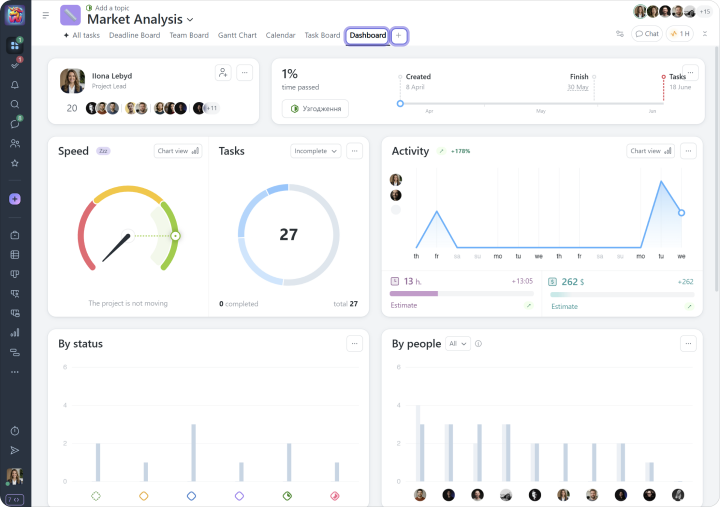
Project dashboard helps quickly analyze the current state of work on a project using various indicators. It is available in every project and is generated automatically based on the data previously planned in the project, as well as the actual work completed and closed tasks.
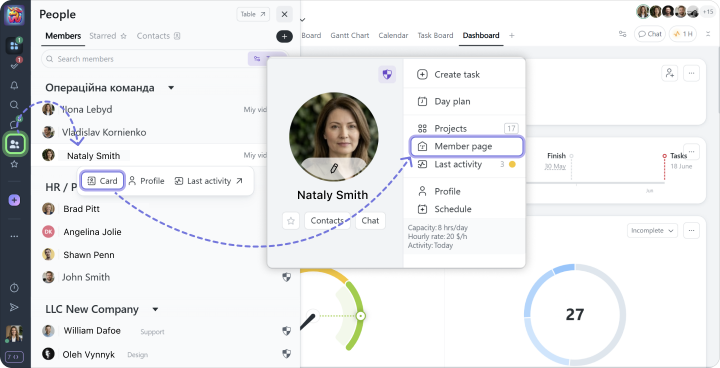
Member dashboard provides an overview of each team member’s activity and involvement. It brings together all key aspects of their work in one place, from the list of active tasks and projects they participate in to detailed statistics and the history of their interactions in the system. This allows you not only to track current progress and workload, but also to get a complete picture of a person’s contribution and role within the team.
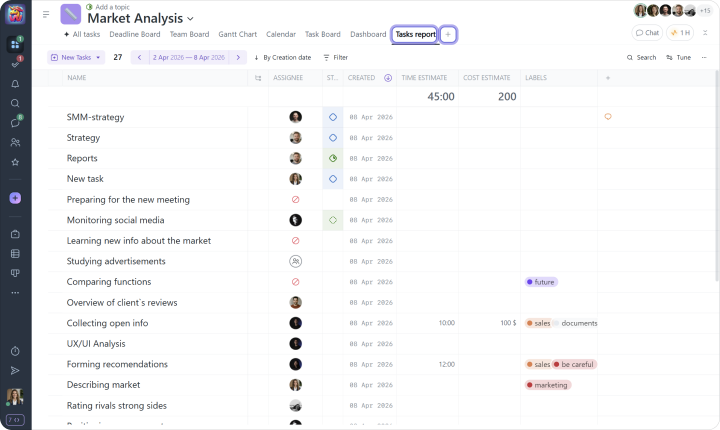
Reports
Different types of reports (Time report, Tasks report, Team report, and Daily report) allow you to get detailed information about a project. They can be customized using various filters and, if needed, exported, for example, to Excel.
Note The system also provides report views across the entire account, which helps you get an overall picture of the company’s work and make management decisions.
Tip If you are subscribed to the “Business” or “Premium” plan, use daily capacity. In this case, in the “People report,” a pie chart will be displayed next to each user, department, and team to help analyze current efficiency. Current efficiency is calculated as the percentage ratio of logged time to the capacity for the past period.