Gantt Chart - one of the most popular project management tools. It is a set of graphical histograms that capture deadlines, dependencies, and milestones of individual components of a project. It was invented by American engineer Henry Gantt in the early 20th century.
The Gantt Chart has been actively used for over 100 years and still remains a fundamental standard for project planning.
Where the Gantt Chart Came From
Gantt was not the first to suggest documenting and planning project results in the form of sequential bars. Before him, Polish scientist Karol Adamiecki did this when analyzing the operation of a rolling mill.
Adamiecki’s task was to harmonize the processes of heavy machinery construction, and his charts were called “harmonograms.” Adamiecki even invented a special device — the “harmonograph,” a kind of analogue to modern project management systems. This device allowed adjustments to be made to the tables without the need to rewrite them completely.
What is a Gantt Chart?
The simplest definition of a Gantt chart is a visual representation of a task list over a period of time. The X‑axis represents time, while the Y‑axis represents the tasks that need to be completed.
The simplest example — choosing a new refrigerator for the kitchen. It can be broken down into several stages:
- analysis of the technical specifications based on which the refrigerator will be chosen (size, location, desired power, and budget);
- analysis of models available on the market;
- purchase of the refrigerator;
- delivery and installation.
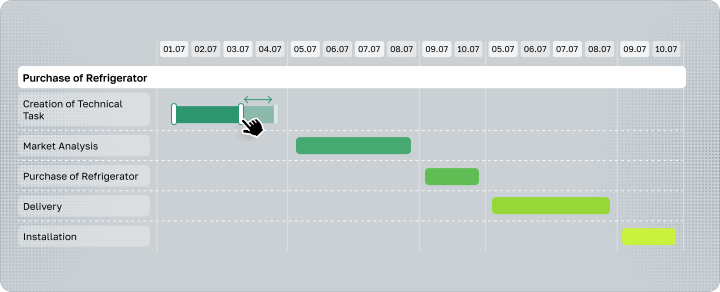
In most projects, achieving an ideal sequence of processes is quite difficult, which is why they often overlap each other and the chart will change its appearance.
Who is the chart suitable for?
The main strength of the Gantt chart is its universality. It is suitable for creating a shopping plan for barbecues as well as for developing the concept of a transnational project. The main question is optics. How detailed do you want to outline the processes and tasks?
The Gantt chart allows you to see the project from the outside and evaluate the scope and timelines of the tasks that need to be completed. The more tasks and subtasks there are, the worse the visualization will work.
From Theory to Practice
Despite its apparent simplicity, creating a proper Gantt chart from scratch requires adherence to specific rules. You need to understand the essence of the project, know what interim milestones need to be achieved, and be aware of which operations need to be performed. The theory is well covered in this blog. Let’s analyze a specific example of purchasing new kitchen equipment.
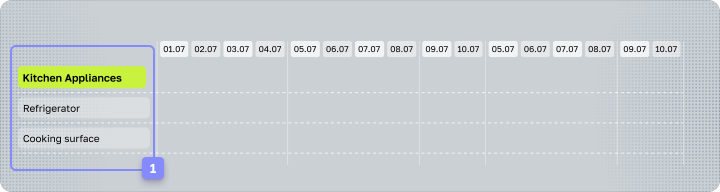
To start, we define the overall objective — buying equipment for the kitchen. Next, we specify exactly what we need to purchase. This will be the basic plan 1 and the desired outcomes.
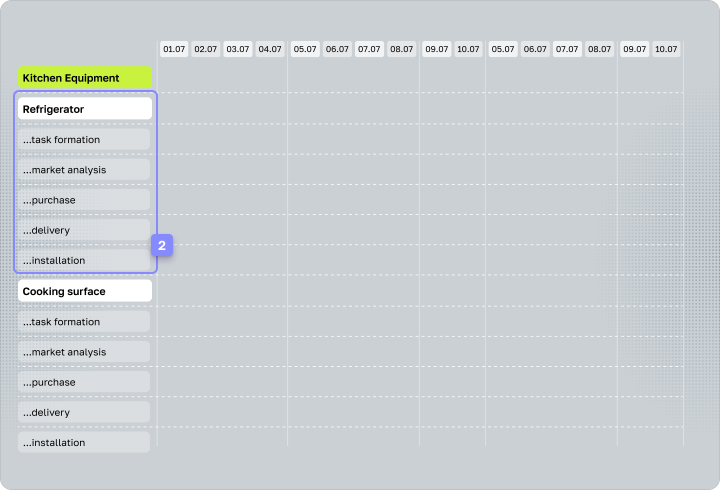
After this, deadlines are established for each outcome and each task
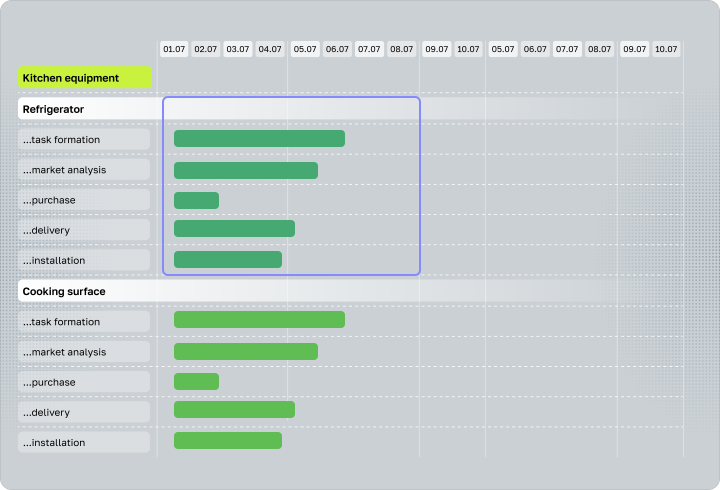
Now these tasks are sequentially placed on the timeline.
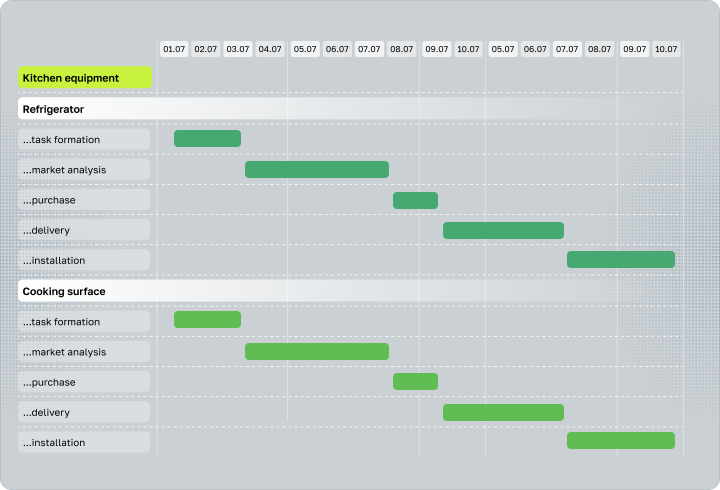
Deadlines for some tasks will constantly change, and as a result, the deadlines for other tasks will also change. Everything will affect everything.
Therefore, creating Gantt charts manually is labor-intensive and inefficient. But there’s good news: this feature is implemented in Worksection at an automatic level.
Examples of Gantt Charts
Gantt Chart for a Marketing Campaign
The Gantt chart helps manage the stages of a marketing campaign, allocate resources, and adhere to deadlines. It shows which tasks are related to each other, which processes require the synchronized efforts of several specialists, and which tasks follow sequentially.
In Worksection, the Gantt Chart allows for flexible work plan adjustments, setting dependencies between tasks, and automatically adjusting deadlines.
 Configuring the Work Plan in the Gantt Chart
1 Identify Key Stages of the Marketing Campaign
Each campaign goes through several standard steps:
- Preparation: market research, media planning, defining KPIs.
- Content Creation: developing creatives, writing texts, video production.
- Ad Configuration: targeting, testing, budgeting.
- Campaign Launch and Monitoring: publishing content, analyzing initial results.
- Analytics and Reporting: performance evaluation, final adjustments.
In Worksection, you can create tasks for each stage, label them accordingly, and set deadlines for completion.
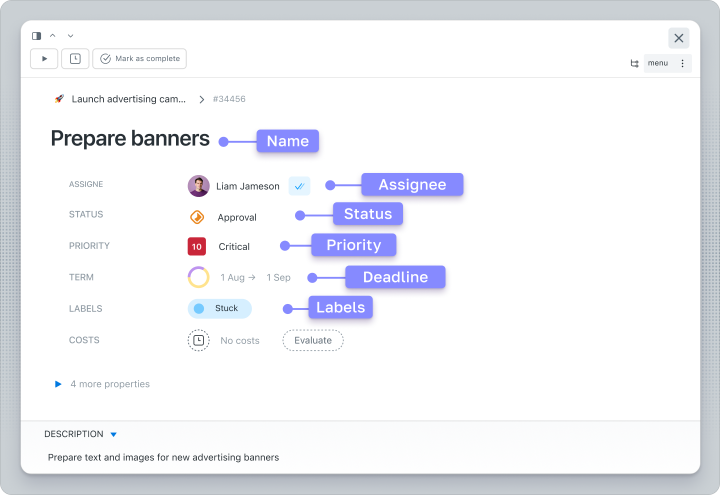
2 Establish Dependencies Between Tasks
Marketing activities are interrelated. Set dependencies between tasks to help align processes.
3 Monitor Task Completion and Adjust the Plan
The Gantt chart shows what has been completed and allows for flexible process management. So if copywriting for creatives is delayed, the Gantt chart automatically shifts the deadlines for related tasks. This way, the entire team sees at which stage the project is, and which tasks are in progress.
 Example of Use
Imagine that an agency plans to launch a advertising campaign on social media. This requires precise planning, as each stage affects the next. In Worksection, you can create such dependencies.
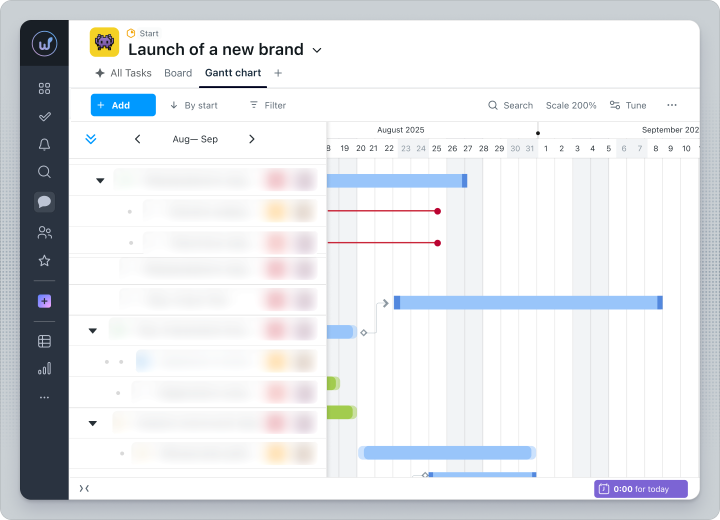
For example, launching the advertisement will only be possible after the content is approved. The results report can only be generated after the campaign is completed. If one of the tasks is delayed, Worksection will automatically update the timeline to avoid overlaps.
 Summary
Use Worksection’s Gantt chart in marketing campaigns for structured and predictable work. Thanks to automatic dependencies, notifications, and flexible deadline settings, the team can:
- Optimize workflow and eliminate chaos.
- Avoid delays and missed deadlines.
- Allocate resources to ensure tasks are completed on time.
- Receive status notifications and promptly adjust strategy.
Worksection helps marketing teams systematically manage projects, reducing manual oversight and increasing efficiency.
Gantt Chart for the Project
When a project consists of multiple tasks and executors, it’s important to create a plan and monitor its execution. The Gantt diagram makes this process clear by visualizing all stages on a timeline. Managers can see the big picture, track deadlines, while the team understands which tasks are running in parallel and which require the completion of previous stages.
How Does the Gantt Chart Work in Project Management?
A project is always a process consisting of sequential and parallel stages. For example, if a house is being built, you cannot start finishing work until the walls have been completed. In IT development, the interface design must be ready before programmers begin the layout.
The Gantt chart in Worksection allows you to:
- Establish dependencies between tasks, so one does not start until the other is completed.
- Assign responsibilities and track their progress.
- Automatically recalculate deadlines if one of the tasks is delayed.
- Balance the team’s workload by distributing work evenly.
Application of Gantt Charts in Different Projects
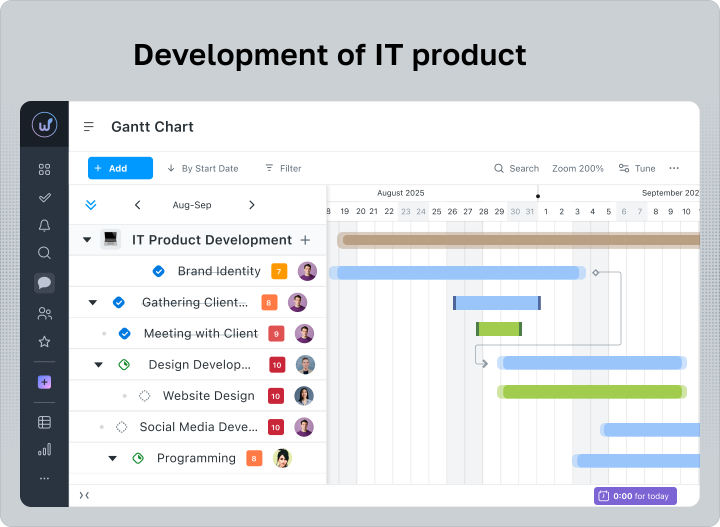
- Gathering requirements from the client.
- Designing the interface.
- Programming, testing, debugging.
- Launching the product.
If the design stage is delayed, all the programmers’ work will shift. In Worksection, the Gantt chart allows you to see and prevent such situations in advance.
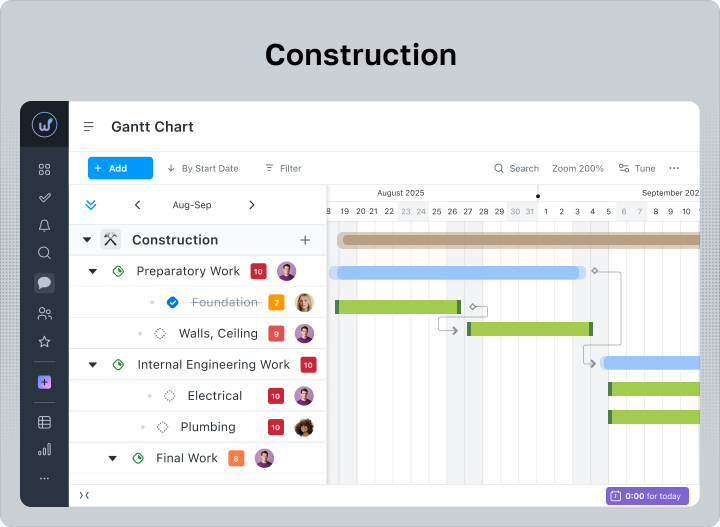
- Preparation works (foundation, walls, roof).
- Internal engineering networks (electricity, water supply).
- Finishing and final works.
If the electrical wiring is not completed, finishing cannot begin, and the Gantt chart shows this immediately.
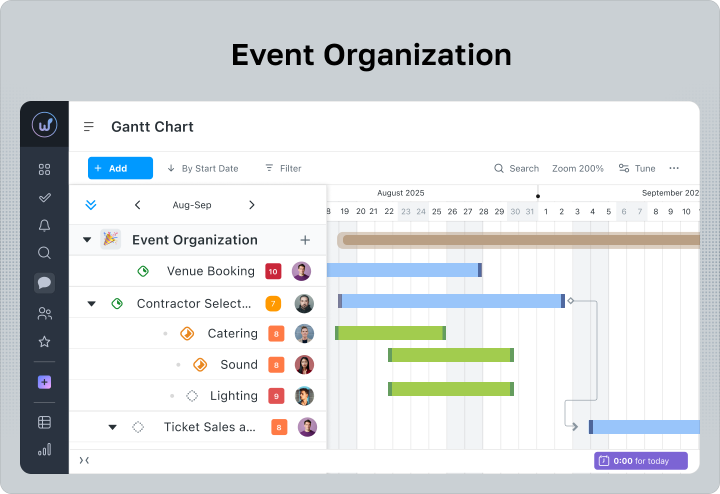
- Booking the venue.
- Selecting contractors (catering, sound, lighting).
- Ticket sales and advertising.
All these stages are interconnected, and without a clear plan, it’s easy to miss important details.
Using a Gantt chart makes project management clear, predictable, and convenient. In Worksection, you can flexibly adjust stages, control dependencies, and automatically adjust deadlines if something goes off plan. This helps to avoid disruptions, budget overruns, and missed deadlines.
To transfer this plan from the example to a working project, you can create a Gantt chart online in Worksection: add tasks, assign responsible persons, and set deadlines.
How the Gantt Chart Works in Worksection
Worksection has an automatic Gantt chart feature. Users can easily change task parameters, move deadlines, and make adjustments to the final schedule as needed.
Let’s consider an example of creating a project for launching an online store. Before the launch, the manager needs to complete several tasks:
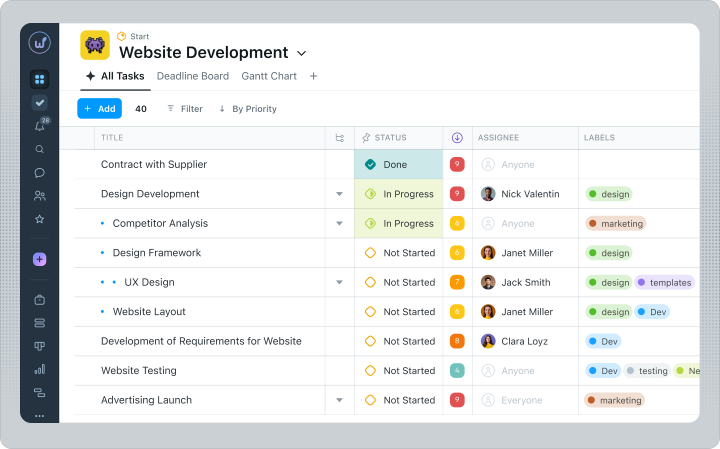
In each task, he writes down the responsible person and the time required to complete the task. Additionally, each of them can have its own sub-tasks, as shown in the task for developing the website design.
Worksection automatically analyzes the set deadlines and forms a schedule from them. To do this, open the project and switch the task view to “Gantt Chart”.
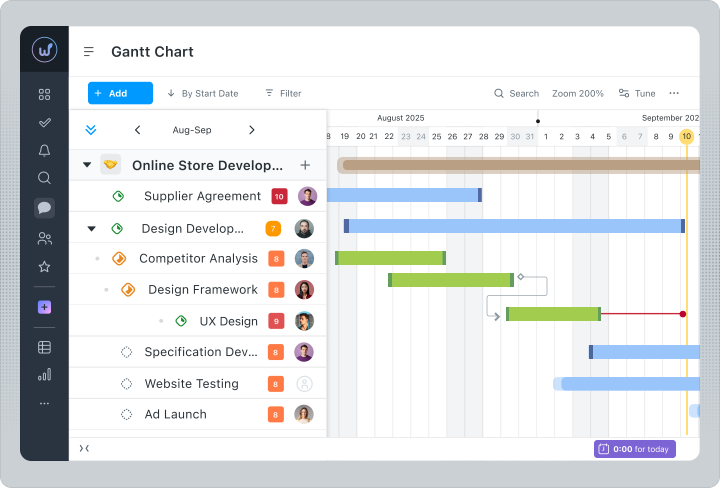
If it’s inconvenient to change deadlines and start times in the tasks themselves, you can do it directly on the Gantt chart. Moreover, the chart will show how many days a specific task has been overdue. Such a line will begin to be highlighted in red.
Main Mistakes (and Why Deadlines Matter)
The main issue that nearly everyone who has worked with Gantt charts faces — deadlines. Deadlines are always tight.
When determining the necessary execution time, it either takes a subjective assessment from the Performer or statistical data collected during previous work.
The author of this material found that according to the normal distribution law, the probability of completing all tasks on time is only 30%. And this is under the condition that the project operates in a field of clearly planned production.
However, if it comes to work, for example, in a web studio, the likelihood will drop lower and lower, depending on various factors.
Important When deadlines are constantly “slipping,” the project manager must constantly adjust the appearance of the chart.
The more adjustments, the less it will correspond to the initial project plan.
In Worksection, this happens automatically and does not require additional labor costs. Therefore, in situations where the Gantt chart stops helping the project, there are still a few functions that allow you to keep the situation under control.
Gantt Chart vs. Kanban Board
In projects that follow the Agile methodology, especially SCRUM, the Gantt chart ceases to be an effective tool. More often, they utilize the kanban board method. However, it cannot be said that these methods are interchangeable.
They simply answer different questions:
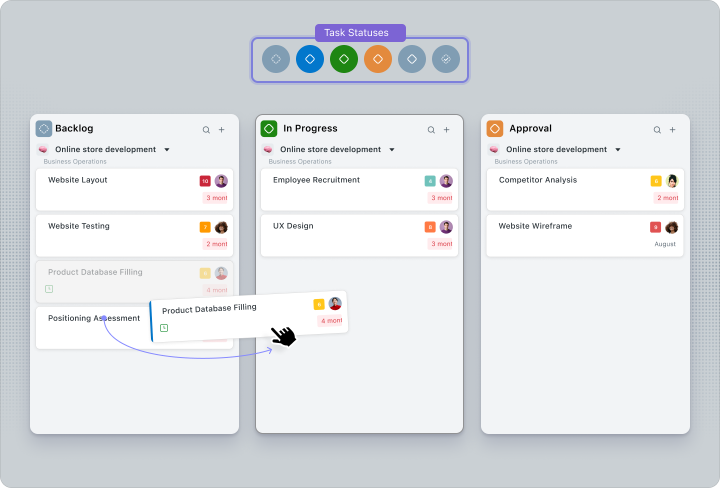
For the same project mentioned above, a kanban board can also be used. It is implemented in Worksection through tags and does not have a strict time-bound connection to task execution
If the design task is almost complete but not yet implemented — this will be visible on the kanban board, but not reflected in the Gantt chart. Therefore, Worksection allows combining these two tools by switching tabs.
Gantt Chart — a commonly accepted, convenient, and most importantly, visually understandable method of project planning. Difficulties when working with it arise if there is a need to constantly manually rearrange task deadlines. However, if automation tools like Worksection are used, this will happen automatically.
The Gantt chart stops working when the project becomes too big and detailed to realistically visualize. Also, if the work on the project is conducted using the Agile methodology. Although in both cases it may be useful for the overall project plan.