Create a Gantt chart online in Worksection
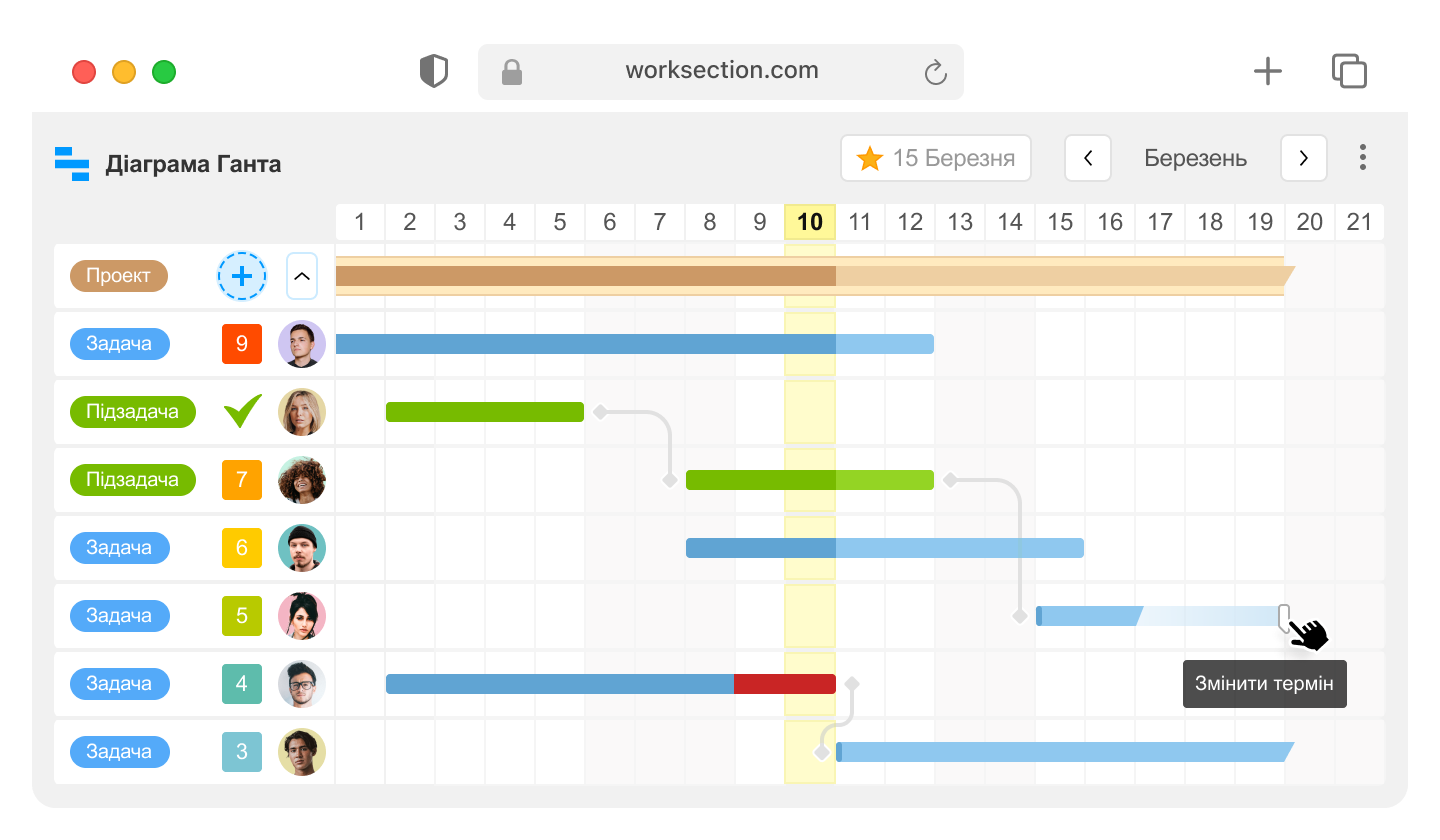
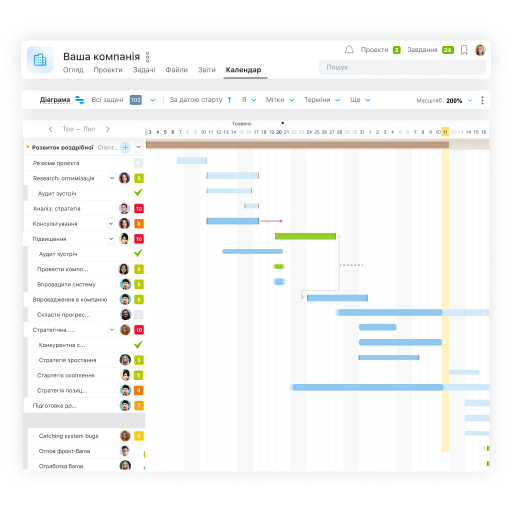
The Worksection Gantt chart is one of the ways to display tasks of your project. Unlike competitors, the Worksection Gantt chart is already built into the system with support for Drag & Drop, inline editing, and critical path.
No additional editors or complex settings are needed. Create, edit, and track tasks in one interface.
Frequently asked questions about the Gantt chart
What is an online Gantt chart and what is it used for?
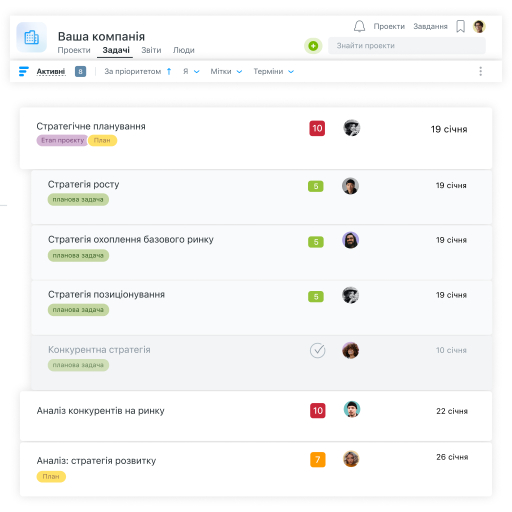
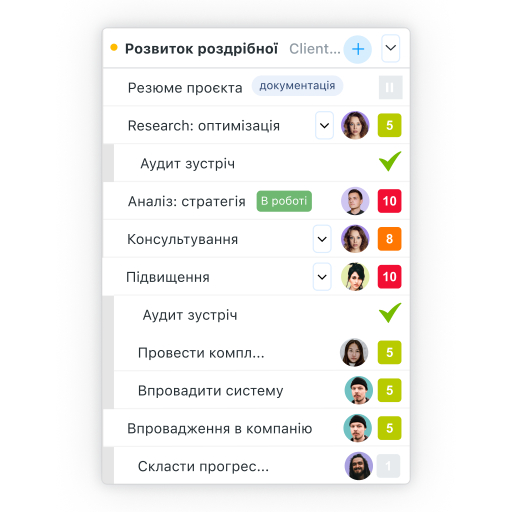
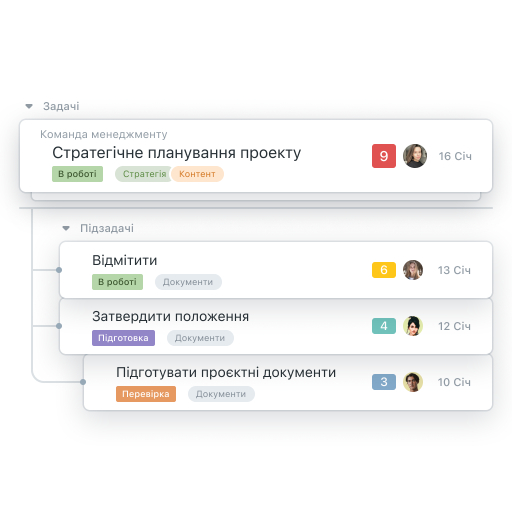
An online Gantt chart is a convenient way to plan and track the progress of projects over time. It shows which tasks are currently being worked on, what is scheduled next, and how they are related to each other.
What advantages does the online Gantt chart have compared to offline tools?
An online Gantt chart is updated in real-time and accessible to the entire team from any device. This ensures transparency, quick responses to changes, and synchronous work on the project.
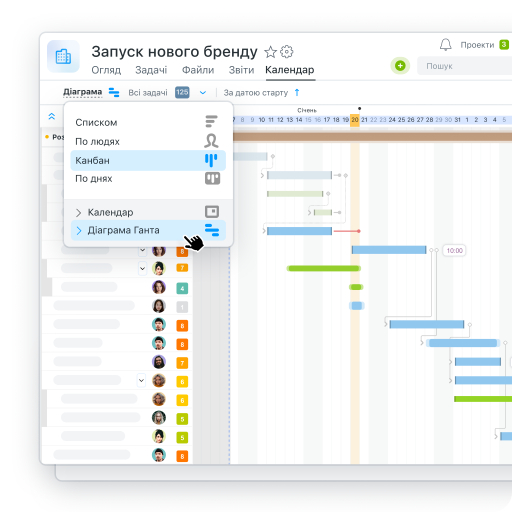
How to create an online Gantt chart in Worksection?
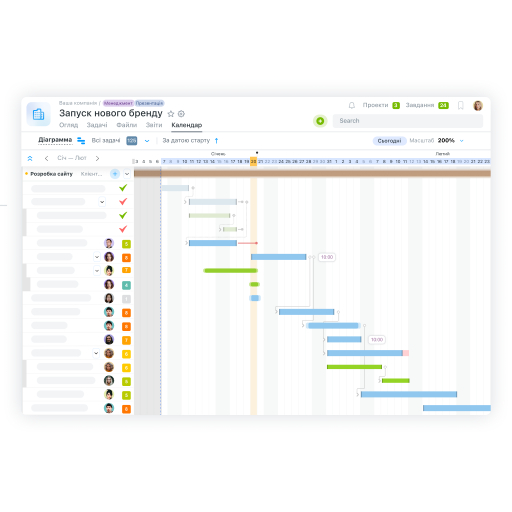
Simply choose a project, add tasks, and open the “Gantt Chart” view mode. You will be able to establish relationships between tasks, set deadlines, and see the complete picture of the work.
Can the Gantt chart be used for planning tasks and resources?
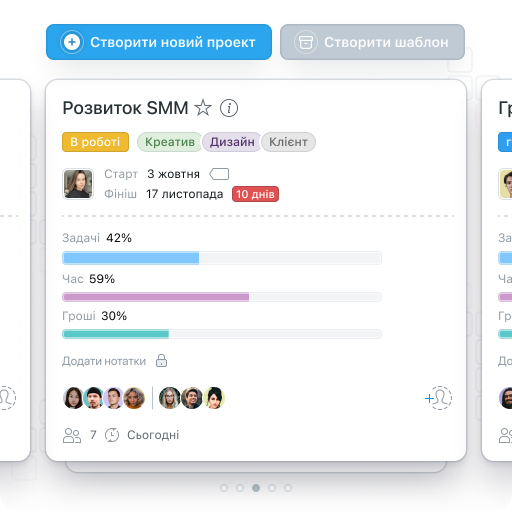
Yes. In Worksection, the Gantt chart helps evenly distribute workload, avoid conflicts between deadlines, and effectively plan team resources.
How does the Gantt chart help in tracking deadlines and project progress?
Worksection automatically updates related tasks when deadlines change. This allows you to see the current status of each stage and respond to delays in a timely manner.
Is the online Gantt chart suitable for working with remote teams?
Yes, all team members see one updated version of the plan. This facilitates coordination, increases transparency, and reduces the risk of errors.
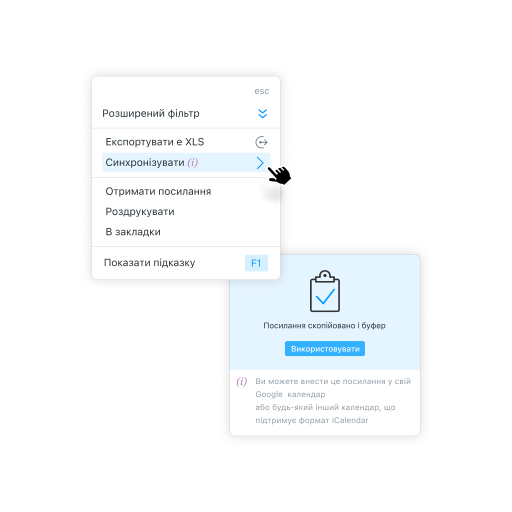
Can the Worksection Gantt chart be integrated with calendars and other services?
Yes, you can synchronize tasks with your personal calendar to avoid missing deadlines. Integrations through API and other services are also available.
Which companies most commonly use online Gantt charts for project management?
Online Gantt charts are used by IT companies, agencies, marketing studios, consulting firms, construction, and product companies. They are particularly effective for complex, multi-level, and long-term projects.