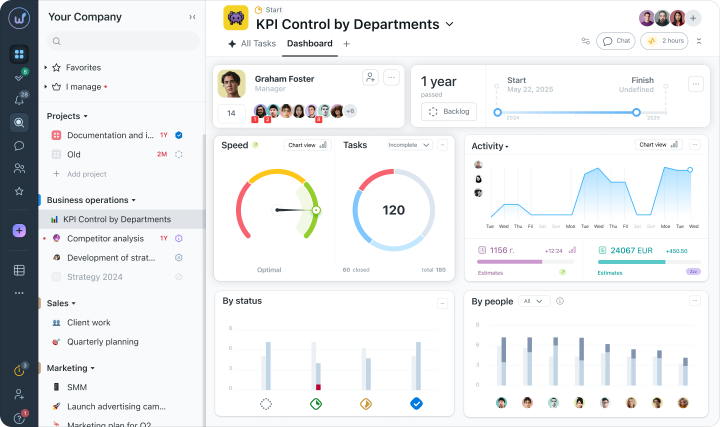
When it’s unclear what working hours are spent on, how tasks are distributed, and what’s actually happening with projects – budgets start to exceed norms and deadlines get pushed. The team can, of course, work at the edge of their capabilities, but the final result still won’t justify the efforts expended.
Fact: According to Eagle Hill Consulting, 68% of employees spend up to two hours each day manually updating statuses, searching for information, and performing other repetitive tasks. On a team scale, that’s thousands of hours a year that the company pays for nothing.
Why do projects exceed budgets?
Let’s explore the reasons:
No control over time expenses
Tasks are assigned unevenly
Lack of risk forecasting
Endless routine consumes all productivity
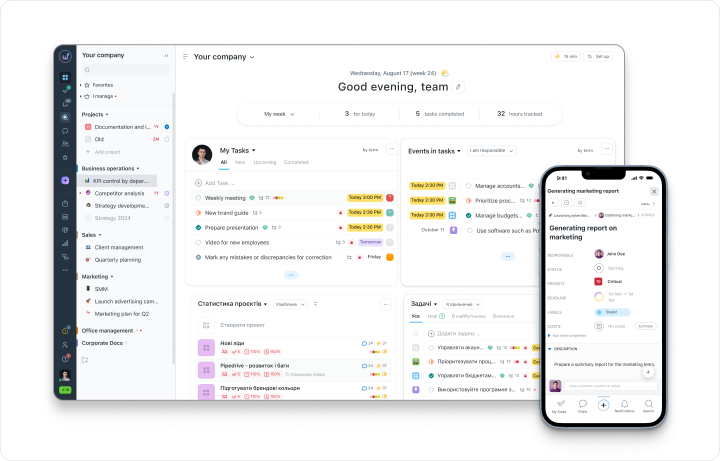
How to start in Worksection 2.0 to prevent money from slipping away?
- Turn on time tracking and specify hourly rates. When the team starts tracking time on tasks, and the system calculates each specialist’s work cost automatically, you’ll finally see the real cost of your projects.
- Create a personal dashboard. Just bring the widgets you need daily to the main screen: team activity, project progress, or priority tasks.
- Trust the system to notify. Set up automatic deadline reminders (in the Business+ plan) and monitor conveniently via “Plan of the Day”.
- Check forecasts regularly. Periodically review task completion speed charts – the system will suggest if there’s a risk of delay.
- Monitor workload balance. Regularly review the activity schedule and the “By People” block to promptly notice who among colleagues is overwhelmed with work and who has free time.
Controlling time and budget is easy!
Time tracking with a timer
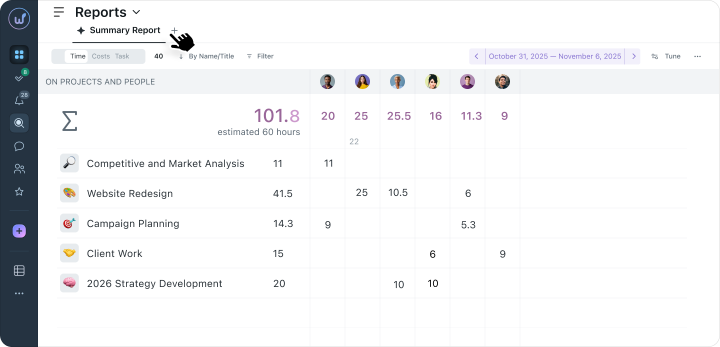
Financial analytics in Worksection 2.0
What financial analytics shows
Plan vs Actual
How much money and hours you allocated for the project at the very beginning, and how much the team has already spent by now.
Convenient comparison
The system displays these figures side by side in columns of the project list.
Filter
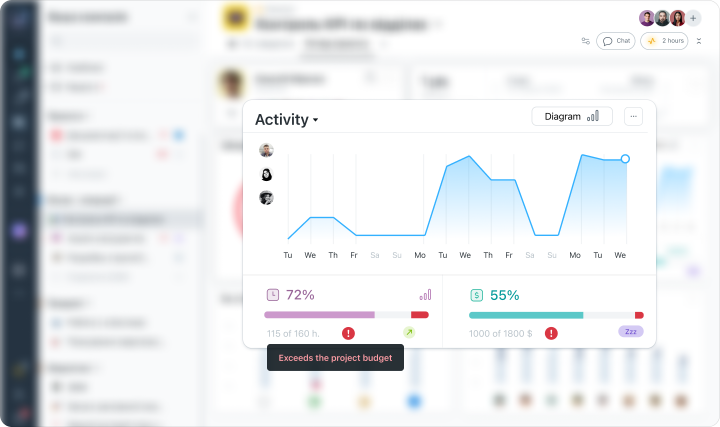
Simply select “Budget Overrun” and the system will show only those projects or tasks that have already begun to exceed the planned funds.
Let’s consider an example
How to balance workload in the team and not miss deadlines?
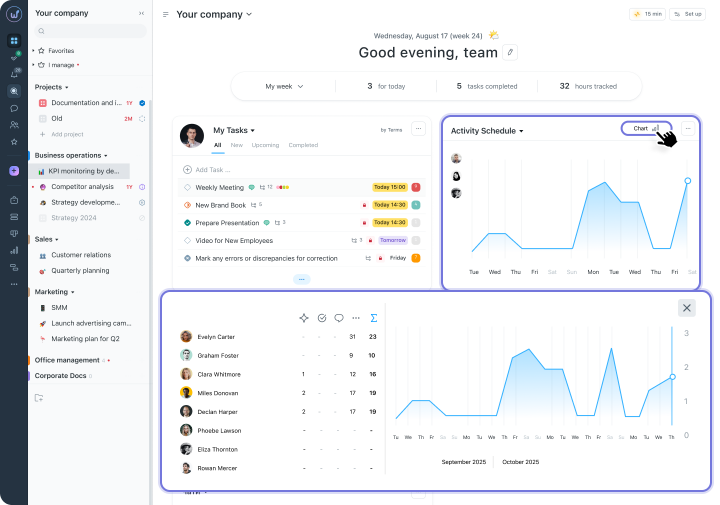
Activity chart, or how to understand the team’s rhythm
You will see:
- Team action dynamics day by day
- Comparison with the previous week
- Internal Top‑3 most active colleagues.
How will this help?
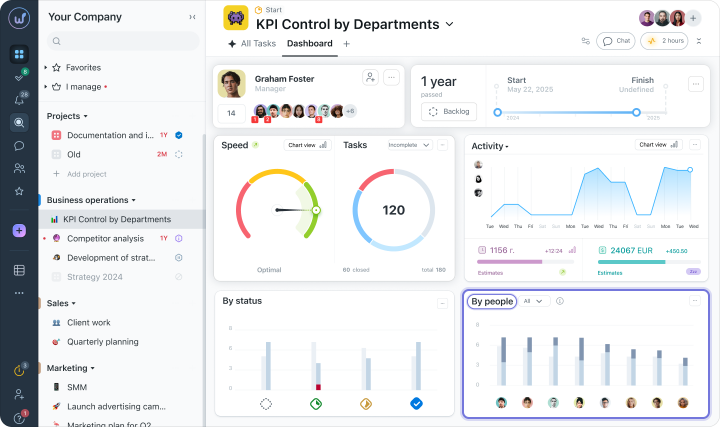
Analytics “By People”
- The number of open tasks for each executor and the dynamics of their closure over the week.
- Tasks that are stuck without an owner (they will be pointed out by the “Not Assigned” button).
What do we have from this?
Plan in time and correctly with the Plan of the Day
What possibilities are there?
- An hourly timeline with tasks for the day for each employee.
- A convenient Drag & Drop tool to quickly drag tasks between time slots.
- Viewing the team’s plans for managers.
How does it work?
When an urgent task comes in from a client that needs to be done immediately, the manager doesn’t need to run around the team asking “Who is free?”. Just open the general Plan of the Day. You can immediately see that two specialists have their day fully booked, while the third has free slots and you simply assign the task to him, saving the deadline.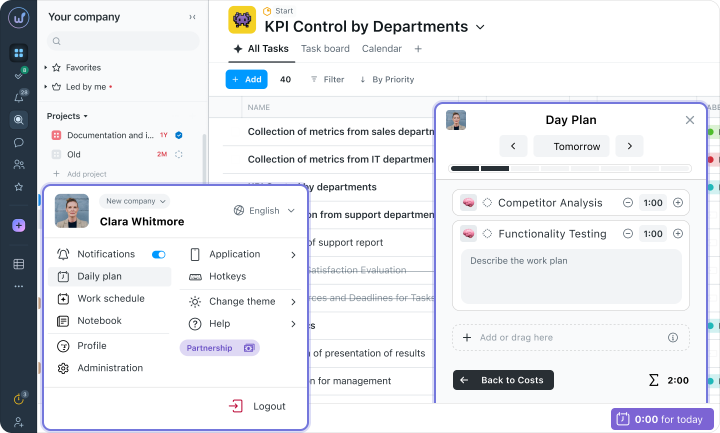
Forecast and manage risks timely
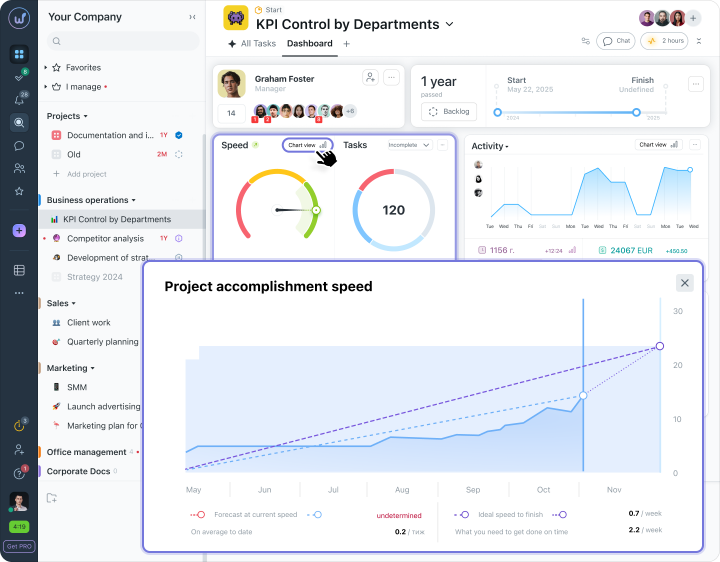
We have a speed chart
- On track – the team is working at a great pace, you can relax.
- Delay risk – speed has dropped, worth paying attention.
- Deadline exceeded – here urgent intervention is needed.
About indicators:
- Color gradient of the speedometer:The needle shows immediately where you are now: in the safe green zone or already shifting towards yellow and red.
- Comparison of lines on the chart: The dotted forecast lines on the graph clearly show the gap between how the team is actually working and how it should be working ideally.
- Digital hints: The system writes out in plain text, for example, “0.2 / week” current speed, but it needs “2.2 / week”. This is your main indicator that the pace needs to accelerate.
Thanks to this, the manager manages the process based on accurate numbers, not intuition. If the radar shows that the current speed is falling behind the ideal, you act proactively: calmly reassign tasks, adjust the workload, or negotiate with the client in advance while there’s still time.
Automating routine
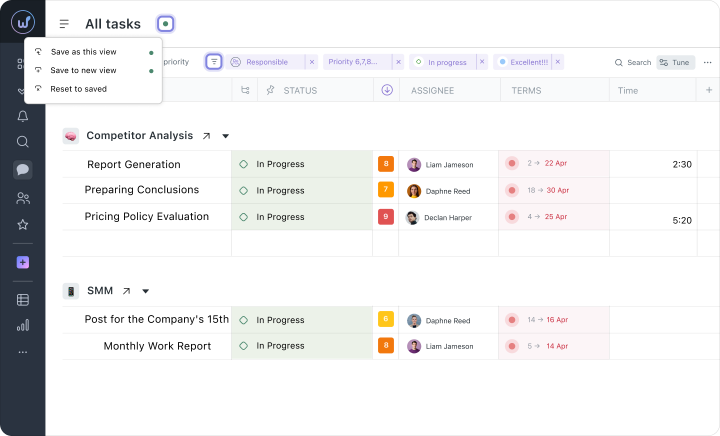
Saved display modes
- My tasks for today
- Overdue by department
- Critical bugs
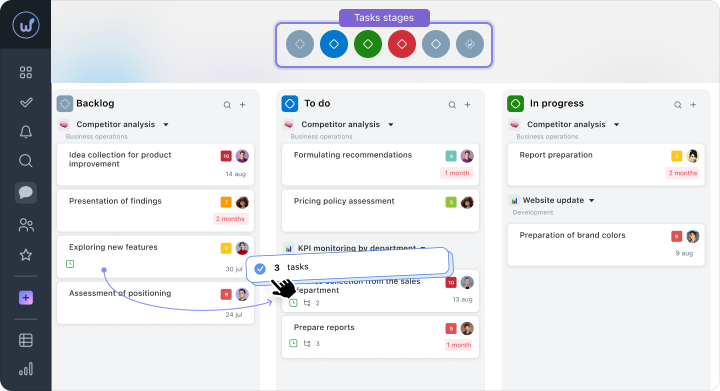
Bulk operations with tasks
- Select multiple tasks using Shift+click or Ctrl+click.
- Change status, priority, responsible persons, deadlines for a group of tasks.
- Move selected cards between columns on the Kanban board via Drag&Drop.
- Copy and delete groups of tasks
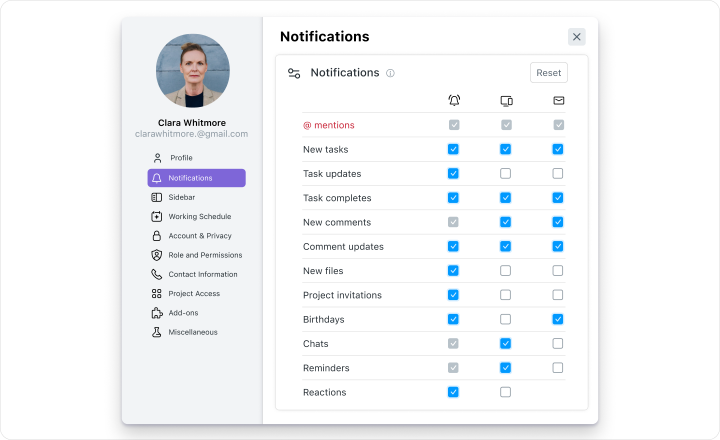
Smart reminders and notifications
- Task reminders – automatic triggers that will send notifications a few days before the deadline or at the start moment
- Task subscriptions – you receive notifications about any changes to tasks that concern you.
- “Do Not Disturb” mode – when you need to focus.
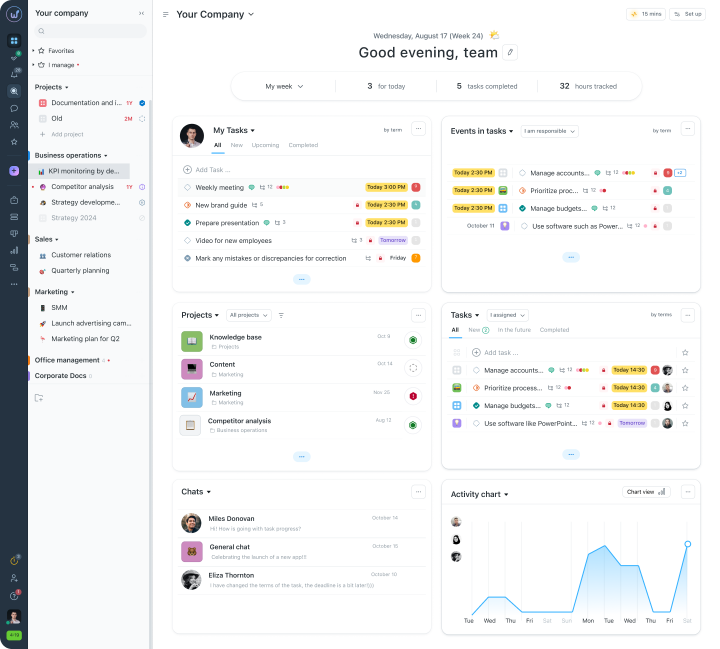
Full picture in 5 minutes on the dashboard
The morning of an average manager starts approximately like this: opening dozens of tabs, checking five working chats, peeking into Google Sheets, and trying to glue it all together. Usually, it takes at least half an hour to gather data. With dashboards in Worksection 2.0, you will find out how things are going in just a few minutes.Account dashboard
- team activity through the “Activity Graph” widget.
- priority tasks in the “Tasks” widget.
- progress on projects in the “Projects” widget.
- important messages in the “Chats” widget.
Project dashboard
- Project timeline – percentage of time elapsed and a forecast date for completion.
- Speed chart – with status zones (on track / risk / exceeded).
- Task chart – closed, open, overdue.
- Activity graph – participant actions by days, top‑3 participants.
- Status distribution – week-to-week comparison.
- People analytics – the number of tasks for each executor and dynamics over 7 days.