The manager is asking about the project. What is usually done in such cases? First, you need to check the task manager, then recall that something was discussed in Slack, and then check if the file the client is waiting for is ready. It turns into an investigation of who did what, where, and how, ultimately leading to confusion.
Transparency is crucial. When it’s clear at any moment what has been done, what is in progress, and where delays may arise. Without this, the team spends time not on work, but on figuring out statuses and priorities.
We’ve ensured that in Worksection 2.0, all of this is visible at once. Dashboards, change history, Kanban, Gantt charts, and reports show the current state of the project without manual information gathering and additional requests. Each participant sees the data they need, while the team works with an up-to-date view of the project in real time.
Where do these questions come from every day?
Initially, the team simply gets used to it, thinking, “Well, it’s somewhere, we’ll sort it out later.” Someone hasn’t updated the status, someone forgot to write in the chat that they finished, and it seems like nothing terrible until these “little things” accumulate to the point where no one understands what is actually happening with the project.
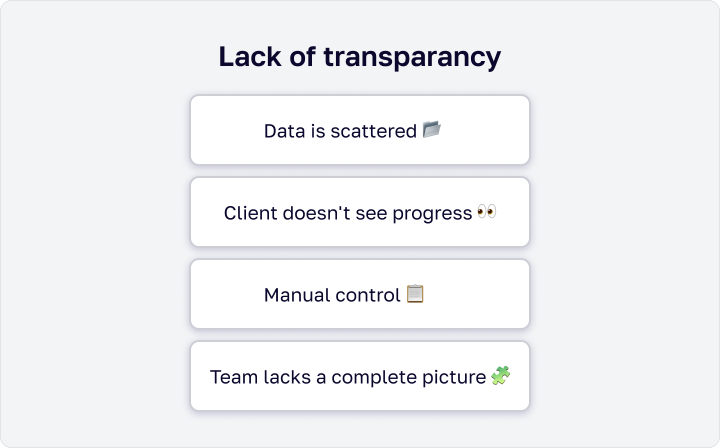
Data is scattered
Tasks in one tool, discussions in Slack, files in Google Drive. To understand what stage the project is at, everything needs to be collected manually. A manager cannot quickly answer a simple question, a new participant struggles to figure out what’s what, and progress seems unpredictable, though in reality, it’s just disorganized.
Manual control
Instead of working, the team reports what has already been done. The manager writes clarifications, conducts status meetings, and gathers reports manually. This distracts from work and creates a sense of constant oversight.
The client cannot see the progress
Without access to up-to-date information, the client is forced to constantly check the status. This leads to more calls, less trust, and the impression that something is being hidden, when in fact, there’s just nowhere to look.
A team without a holistic view
When it’s unclear how individual tasks influence the outcome, priorities get lost. This leads to duplicated work, overlooked dependencies, and even experienced participants make mistakes due to a lack of context.
How easy is it to control everything in Worksection 2.0?
Gathering updates about the project manually is probably the most tedious thing you can think of. Therefore, in Worksection 2.0, we’ve changed this logic a bit; now the system pulls and visualizes everything happening in development itself.
View everything at once with personalized dashboards
Instead of bothering the team with calls every morning asking about the status of tasks, you can just open the main page. In Worksection 2.0, the dashboard shows each person exactly what they need for their work: a product manager sees overall progress and deadlines, a developer sees their tasks for today, and a manager sees the overall status of all projects.
The workspace is assembled from distinct blocks – widgets. You can add them, remove them, rearrange them, or adjust filters to see only useful information.
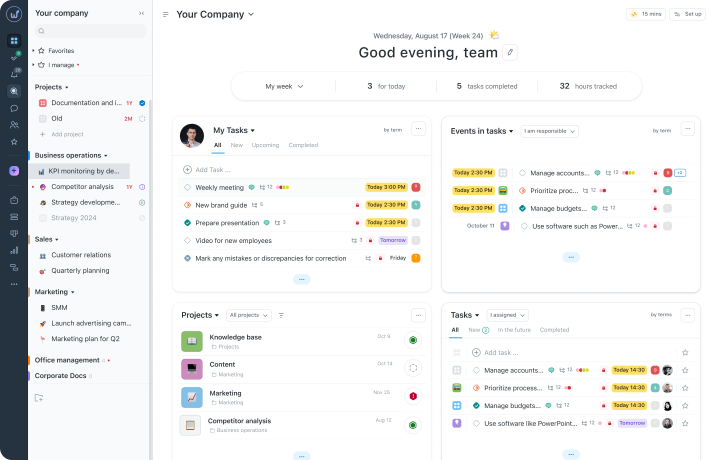
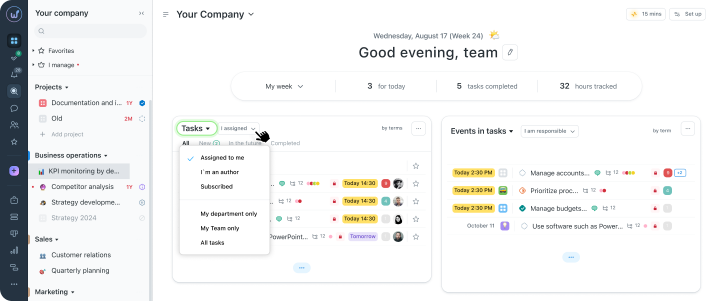
For task management, there is a convenient block “Tasks”. Here, all your tasks or your team’s tasks are collected. The advantage is that you can change the status, switch assignees, or move deadlines directly from this screen without needing to go into each task.
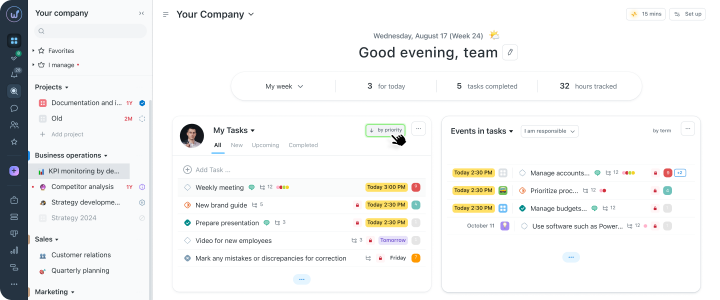
Quickly sorting out deadlines is made easy with the widget “Priorities”. The system itself identifies the most important tasks across all projects and divides them by colors:
- critical:
- important
- normal
In the morning, it’s immediately clear what to start the day with.
Tracking the team’s workload is aided by the activity graph. It shows who worked on tasks and when throughout the week. This makes it clear if someone is overwhelmed with work while others have time to help their colleagues.
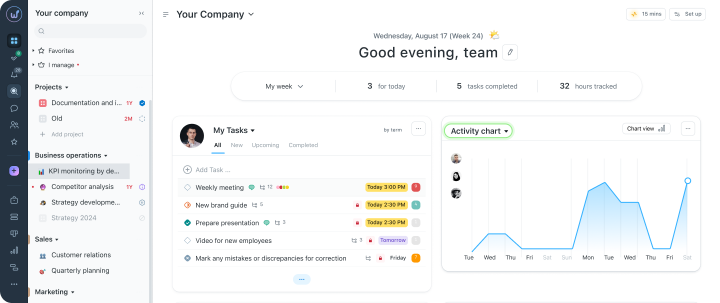
The global picture of the company is shown by the widget “Projects”. Here, you can see all active or paused projects with progress indicators. You can quickly assess what percentage of work has been completed for each one.
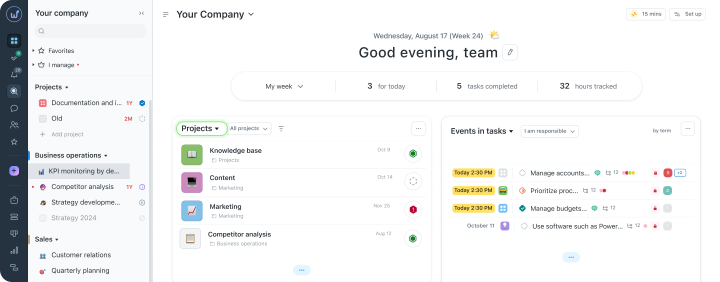
And if it’s important for you to keep track of every change, there’s the widget “Events”. It shows the most recent actions on the project in chronological order. You will immediately see if someone left a comment, changed a task’s status, or uploaded a new file, and you can easily jump to the relevant task.
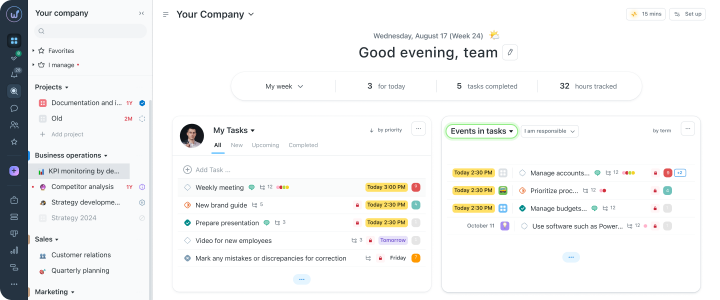
All this data updates automatically, so you no longer have to collect statuses manually. Plus, we’ve made sure that most quick actions can be done right from the main screen.
There’s a history of changes – no more “Who changed the deadline?”
In project work, there’s one truth – things are constantly changing. Deadlines shift, new assignees are added, tasks are moved to different stages, and so on. The problem arises because after a week, no one remembers why such decisions were made in the first place. The context simply gets lost.
In Worksection 2.0, you won’t have to rely on memory. The system automatically records everything from the moment a task is created to any changes in statuses, priorities, responsible persons, or added files. Comments and even time-tracking records are stored here as well.
For this, there’s a “Activity” tab in each task block. Everything is listed in a clear chronological order – what changed, when, and who did it.
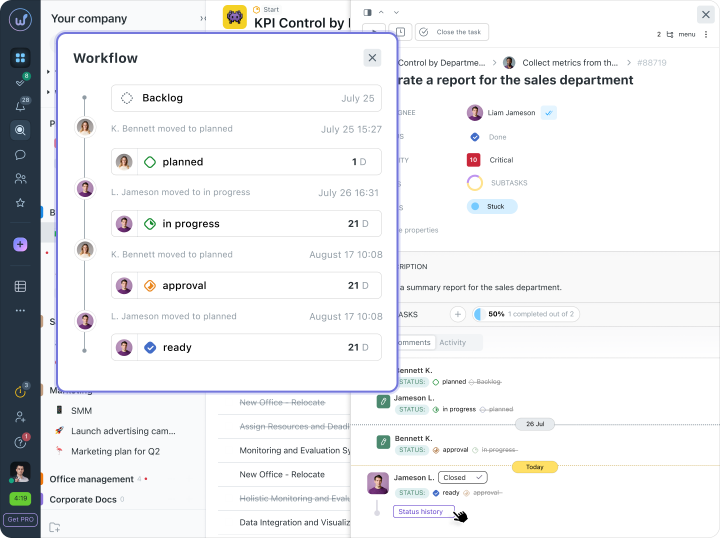
This greatly simplifies life for the entire team. For example, if a new person joins the project, they don’t need to run around asking about everything. It’s enough to just look at the history to understand the entire context of the work. And most importantly, unnecessary arguments disappear in the team, as every decision is recorded and can be easily verified.
How Kanban and Gantt charts help to see current tasks and plans?
When there are too many tasks, everyone tends not to celebrate. In a plain list, it’s hard to quickly determine what is really moving and what is simply stuck in place.
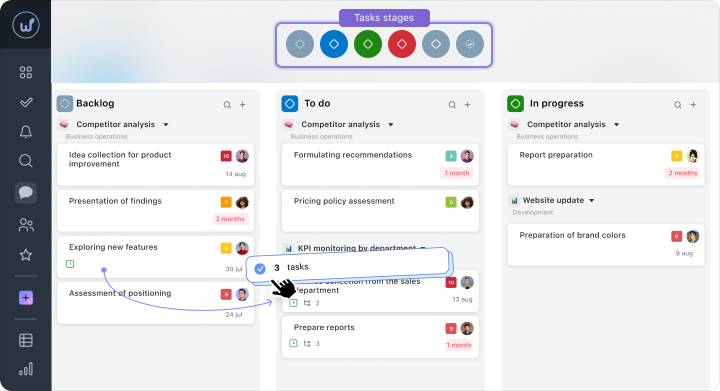
The Kanban board shows all work in real time. Tasks are organized in columns “Planned”, “In Progress”, or “Awaiting Approval”. The team immediately sees the current state of affairs. If plans change, the status or assignee can be updated directly on the board by simply dragging the card. This helps notice in time where work is piling up and who in the team is overwhelmed.
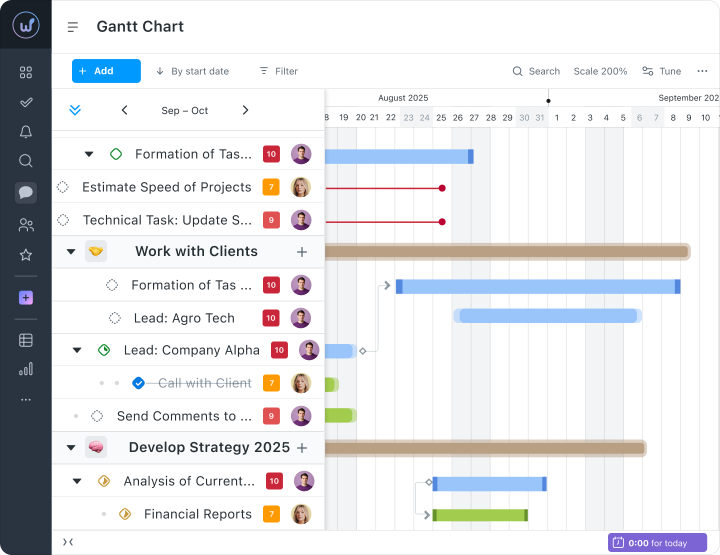
While Kanban shows what is happening now, the Gantt chart helps to understand what will happen next.
Tasks in a project are usually interconnected and follow one another. If one deadline is extended, others automatically shift, but this is hard to notice in a general list. On the Gantt timeline, all these connections are visible at once.
You see the duration of each task and how the project’s progress aligns with the initial plan. If any stage is delayed, the system highlights the risks, allowing you to adjust deadlines or redistribute efforts before problems with deadlines arise. As a result, everyone understands the work principle, and the manager sees the overall picture and acts proactively.
Counting actual time with time tracking and reports
Explaining to a client or management where the week of work went is much easier when you have exact numbers rather than approximate estimates. However, recalling and recording hours post-factum is a whole different story.
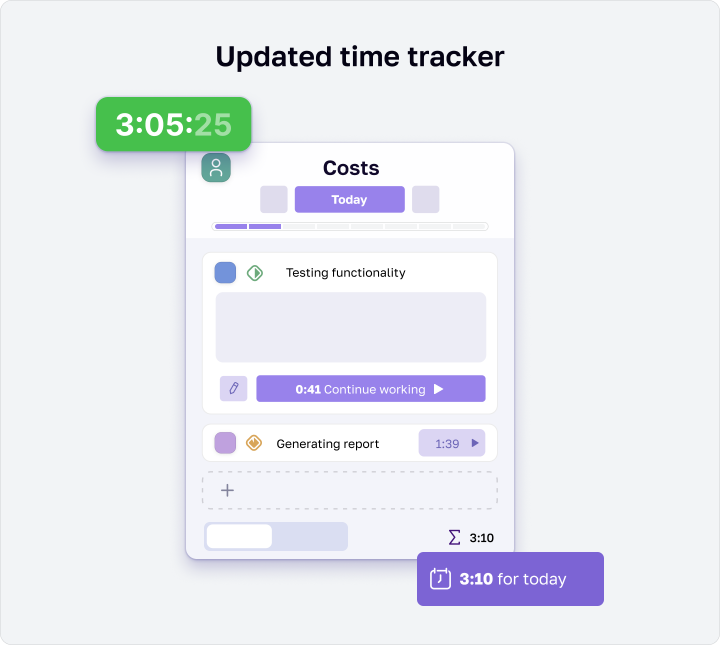
And to avoid having this separate conversation and other issues, in Worksection 2.0, we made it so that time is recorded right during the work on the task. The assignee simply starts the built-in timer or adds worked hours manually, providing a brief comment. The information is immediately saved within the task card. As a result, you clearly see how many hours a specific task consumed and who worked on it.
When it comes to the end of a project, data collection usually begins from all over the place to compile at least some report. In Worksection 2.0, there’s no need to compile everything manually, as the system automatically gathers all recorded hours into understandable charts.
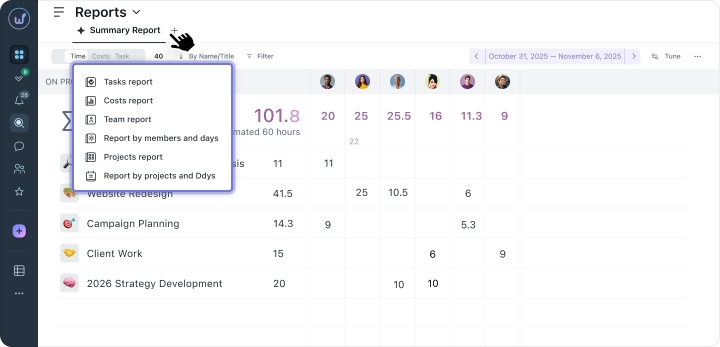
You can generate a report in just a few minutes to review the total number of hours for the project, compare the planned time to the actual, or assess the workload of each team participant. This kind of report is easy to export and show to the client, thus eliminating all unnecessary questions about where the budget went.
Showing the client what they need through the “Guest” role
Of course, sharing work progress with the client is right, but showing them all drafts, financial details, or internal correspondence with various discussions is definitely not advisable.
However, without a sense of control, the client will feel anxious and may not always trust. And that’s fair, which is why we found a balance by giving control without allowing it to interfere with the team’s work.
In Worksection 2.0, this is set up through the “Guest” role. You decide which part of the project to open. The client will be able to access the system, see approved tasks, current statuses, deadlines, and final files. They can leave comments directly in the task context, but all internal processes: technical tasks, finances, time-tracker notes, and purely team chats remain invisible to them.
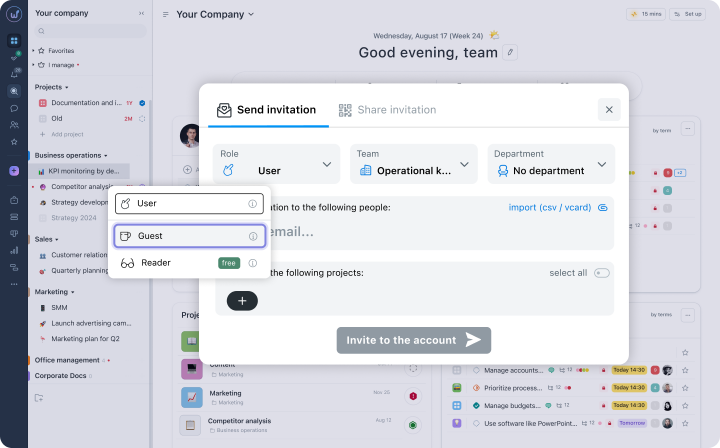
Moreover, this also saves a ton of time. The client no longer needs to ask about the project daily, as they can log in at any moment and see the progress for themselves. The team can calmly do their job, maintain internal dialogues, without being distracted by endless status updates.
Bringing order to tasks with a tabular view
A regular task list can be useful for improving team work, but what if there are hundreds of tasks? The list becomes lengthy, nothing is clear, and everything gets lost. We shouldn’t let ourselves “sink” into this chaos.
That’s why we created a tabular view. It gathers all tasks into an understandable grid that helps quickly orient yourself when you need to scan the entire array of tasks at a glance. You customize the columns, group tasks by deadlines, assignees, or statuses.
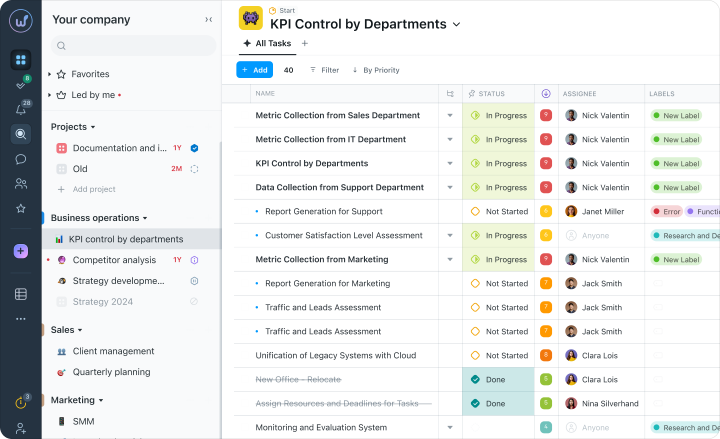
If you need to update dates or reassign tasks to another colleague, there’s no need to open each card separately. All changes can be made directly in the table cells, just like in regular Excel. This saves a lot of time when you need to quickly tidy up a large volume of work.
You can work even better
The worst part is when half the day goes not to work, but to clarifications like “who is doing this” and “where is it located.” This is exhausting for both the team and the managers.
Worksection 2.0 is exactly what’s needed to eliminate all unnecessary clutter. When statuses, change history, and deadlines are open and clear, the need to ping each other in messengers every hour or gather another call for thirty minutes just to find out the status of a task disappears.
And it leads to a simple story, where there’s less mess, less duplication, and much more peace to just do your job.
Switch to Worksection 2.0 and see how it feels to work without unnecessary headaches.