Solutions
worksection
beta
help
What is a Gantt chart and how does it work?
A Gantt chart is a horizontal timeline that shows tasks and projects as bars. The length of a bar matches the task’s duration, and its start and end match the start date and the deadline.
The Gantt chart is available on the Business and Premium plans.
Gantt chart modes
There are two ways to work with the Gantt chart.
| Account-wide Gantt chart | Project Gantt chart |
|---|---|
| All projects and tasks you can access | A single project |
| Opens from the left sidebar | Opens from the project tabs |
| Best for overall planning | Best for work within one project |
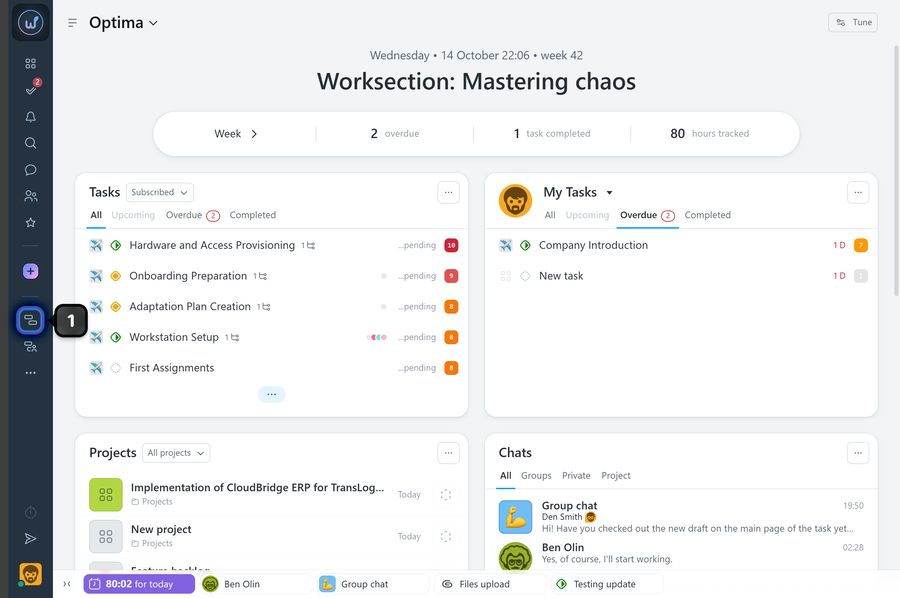
To open the account-wide Gantt chart, click the “Gantt Chart” button1 in the left sidebar.
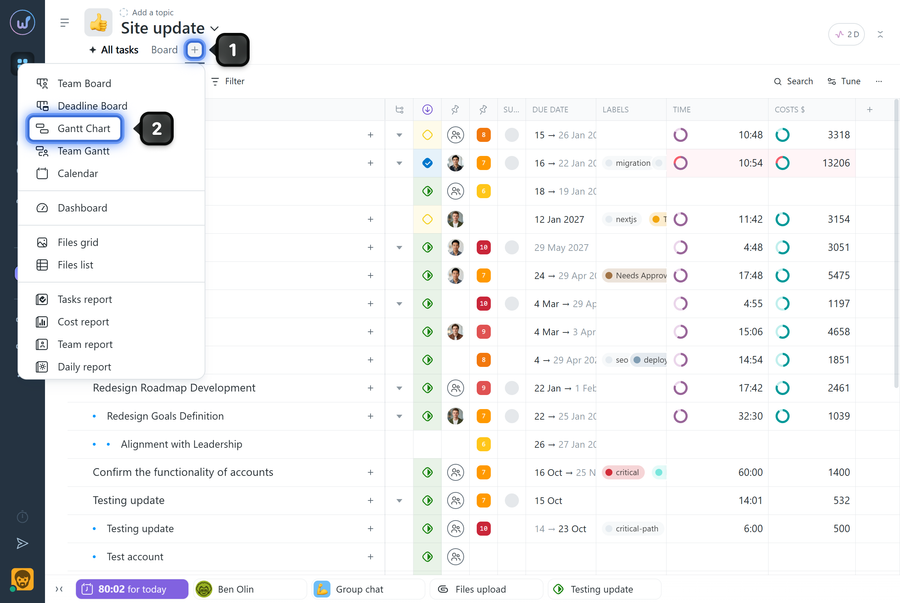
To open a project Gantt chart, click the “+” button1 on the project page and choose “Gantt Chart”2.
What does the chart show?
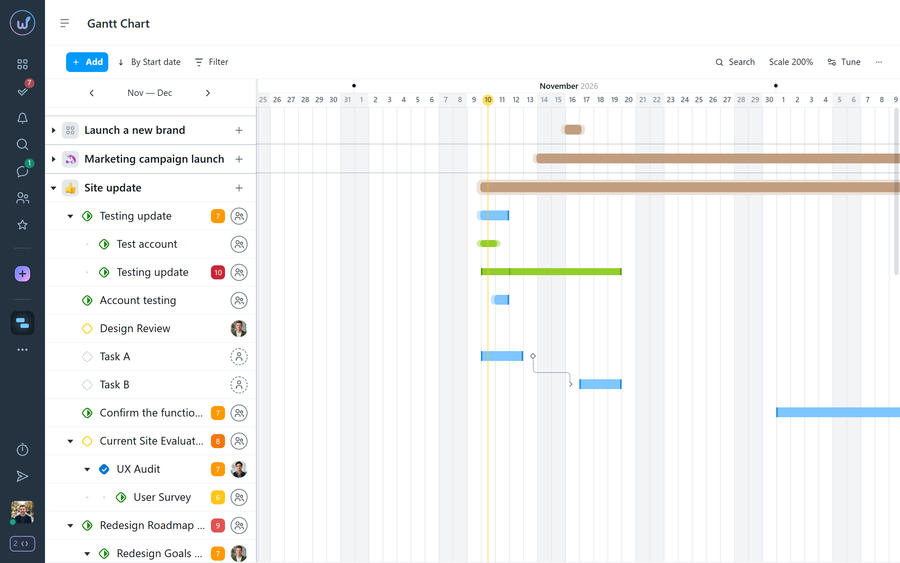
The chart shows projects, tasks, and subtasks.
The left side of the page is the list of projects and tasks. The right side is the timeline with the matching bars.
What do the bar colors and shapes mean?
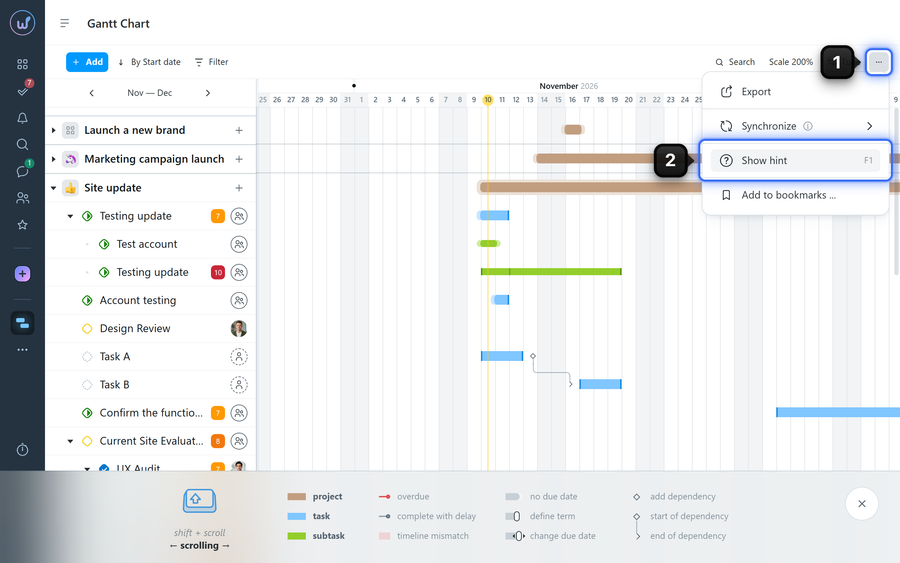
The chart uses color coding to make it easier to read. Projects, tasks, and subtasks have different colors. In addition, the color intensity and the shape of the bar ends carry meaning depending on the status:
- red — the task is overdue;
- light red — the task was completed with a delay or conflicts with the parent task’s deadline.
The full legend of colors and shapes is always available right on the page — press F1 or choose “Show hint”2 in the three-dots menu1.
Leave your review
Did this article help you?
Glad we could help! What was helpful?
Sorry this didn't help. What went wrong?

