Solutions
worksection
beta
help
How to print a Gantt chart?
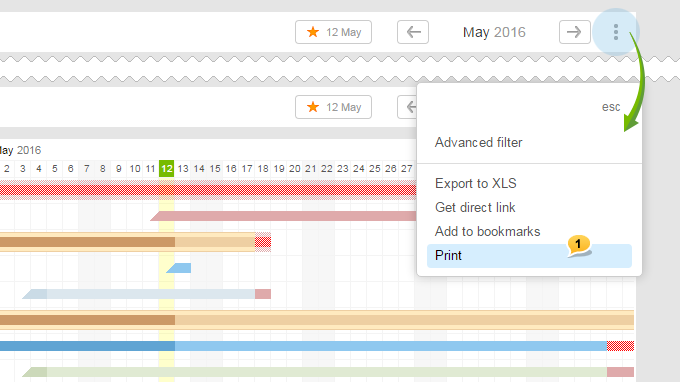
For this, on the page with the chart, click the drop-down context menu and select «Print»1.
In the appeared window, you can select the page size and specify temporary time scale of the diagram (1,2 or 4 days).
When changing the scale to «day 2», the time interval two times bigger will fit on the printout, the same way as if you change it to «4 days», it will be 4 times larger.
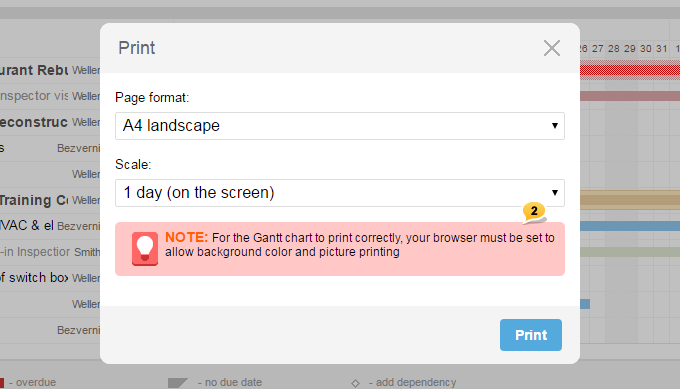
Please, note! In order for the Gantt chart to be printed correctly, background colors and images must be enabled in the browser2.
Leave your review
Did this article help you?
Glad we could help! What was helpful?
Sorry this didn't help. What went wrong?

