Solutions
worksection
beta
help
Is it possible to change the scale of a diagram? How to move the chart back and forth in time? Which tasks are displayed in the diagram?
The scale of the Gantt chart is fixed when viewed in a browser. With the standard scale, a temporary period of two months is placed on the screen. However, using the horizontal scroll bar at the bottom of the screen1 (or «right» and «left» cursor arrows), you can move the chart back and forth in time.
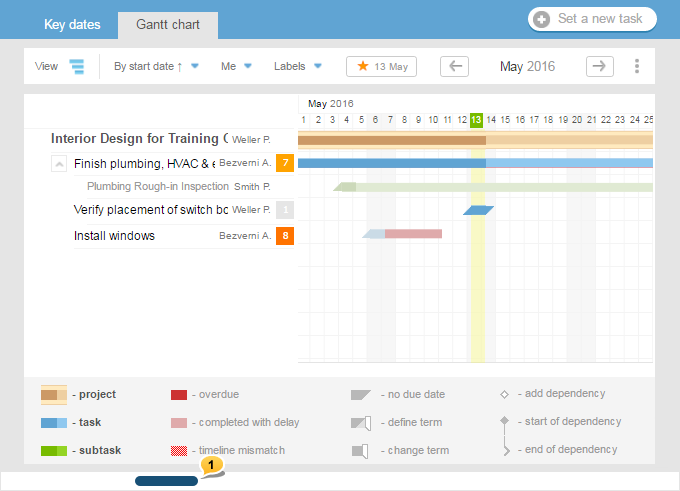
When scrolling the chart, only those tasks remain in the list of tasks that fall within the length of time visible on the screen.

The diagram can be 2 or 4-times (see the answer to the questions).
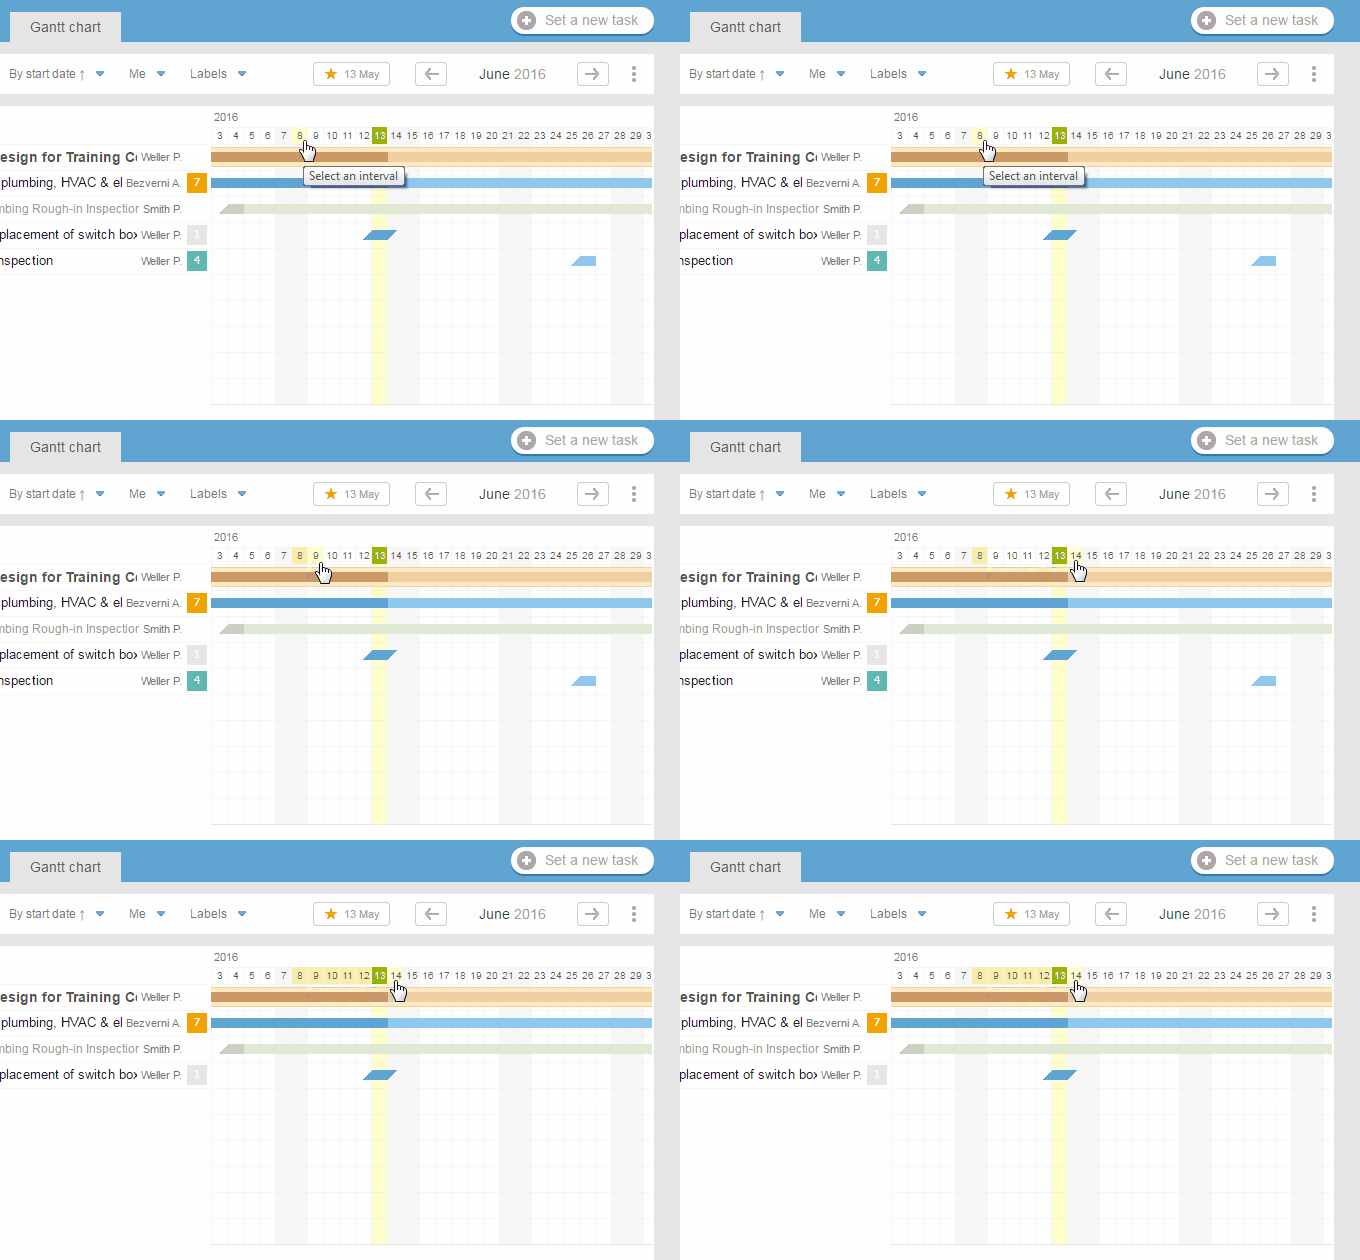
The time interval can also be set manually to display tasks. In order to do this, you just need to click on the start and end dates (not necessarily by aAscending date). Dates in the selected range will be highlighted in yellow color, and only those tasks will be displayed that fall (at least partially) in the selected interval.
If do not click on a date but on a month, then the entire month will be selected as the interval.
When printing, you can change the chart scale to increase the range of dates that can fit on the screen.
Leave your review
Did this article help you?
Glad we could help! What was helpful?
Sorry this didn't help. What went wrong?

