Solutions
worksection
beta
help
Project overview page (Project dashboard)
The project overview page is the dashboard of a specific project: its widgets show real-time summary information within that project (members, tasks, activity, statistics, and more).
How to open the project overview
Open the project you need and go to the “Dashboard” page1 in the project’s tab bar.
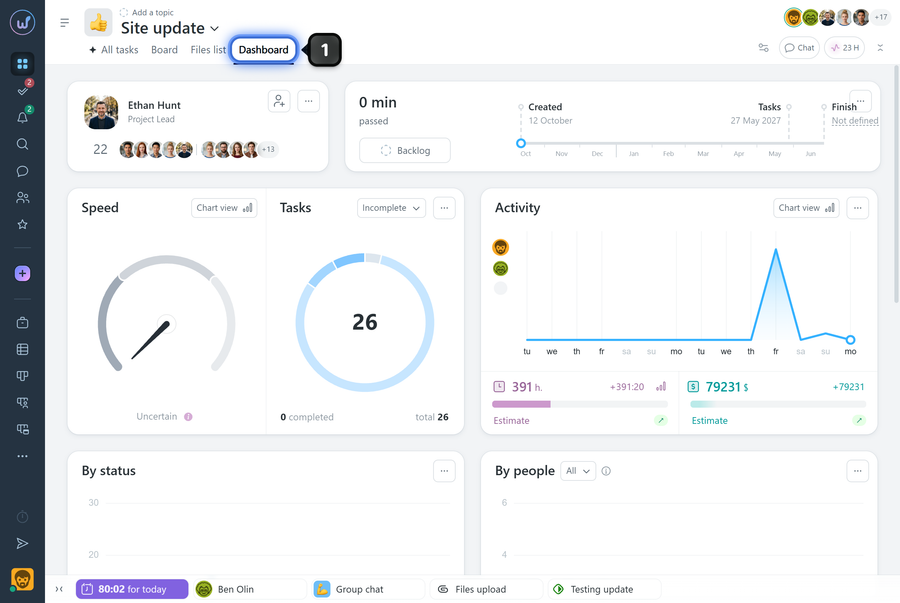
The overview page includes the following widgets:
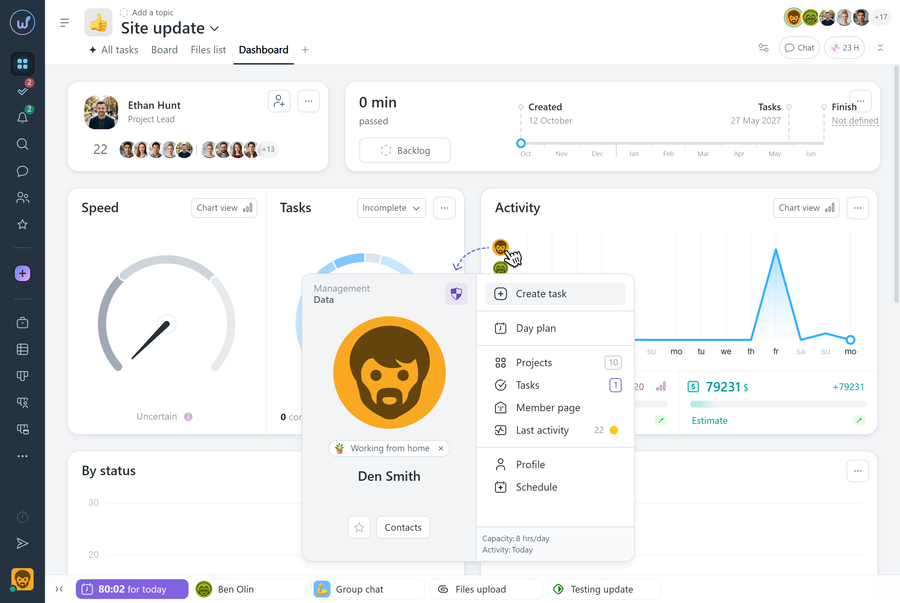
- Members — project members and quick actions with them (for example, the member card that opens when you right-click an avatar);
- Speed — the pace and progress of work within the project;
- Activity — a visual timeline of actions by day, showing how work in the project is going;
- By status — a summary of project tasks by status;
- By people — how tasks are distributed among project members;
- Tasks — a list of project tasks with filters, sorting, and quick access to the task card;
- Events — a summarized view of changes to project tasks;
- Timeline — a visualization of the project’s dates;
- Member statistics — a week-by-week comparison of member metrics;
- General stats — summary metrics for the project.
Turning widgets on and off
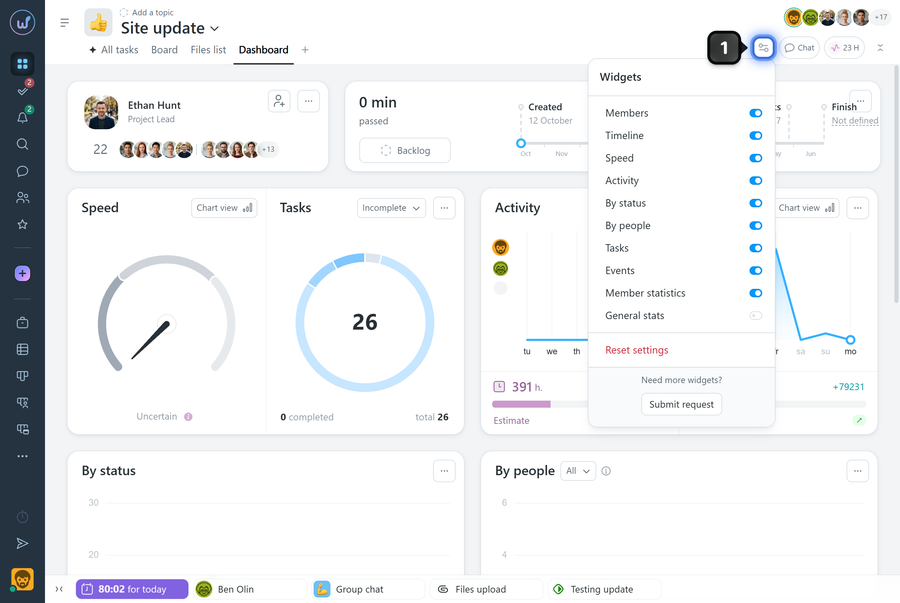
On the project overview page, click “Tune”1. A list of widgets with toggles will open — turn on the ones you need and turn off the rest.
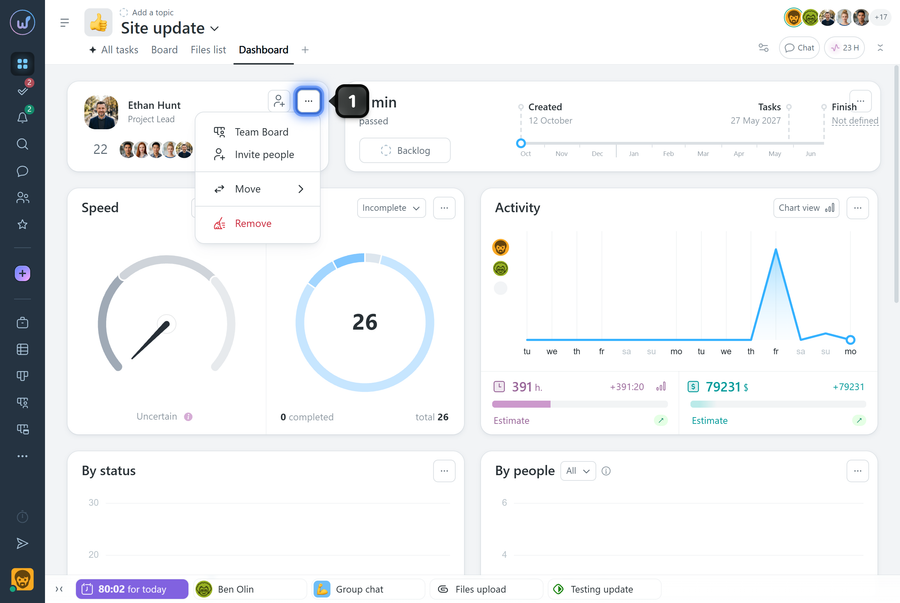
Each widget has a “three dots” button1 in its upper-right corner. Clicking it opens additional actions; some of them depend on the widget type and your permissions. Options common to all widgets:
- Move — change the widget’s position relative to the others on the overview page;
- Remove — hide the widget from the overview dashboard if you don’t need it;
Widgets are interactive. For example, wherever members are shown, right-clicking an avatar opens the member card.
Please note! The order and visibility of widgets are set individually — each member has their own view of the page.
Why it all comes together
The project overview brings the key project metrics together in one place: who is on the team, how tasks and statuses are moving, and what the activity and statistics look like. Once you set up the widgets for yourself, you can quickly understand the state of the project without going through every section separately.
Leave your review
Did this article help you?
Glad we could help! What was helpful?
Sorry this didn't help. What went wrong?

