WORKSECTION

Gantt chart

What is Gantt chart?

Gantt chart (also strip chart, Gantt graph) is a popular type of bar charts (histograms), which is used to illustrate a plan/ schedule of work for a project. It is one of the project planning methods
used in project management applications. At present, the Gantt chart is the de facto standard in the theory and practice of project management, at least, when it comes to displaying the structure of a project wok list.


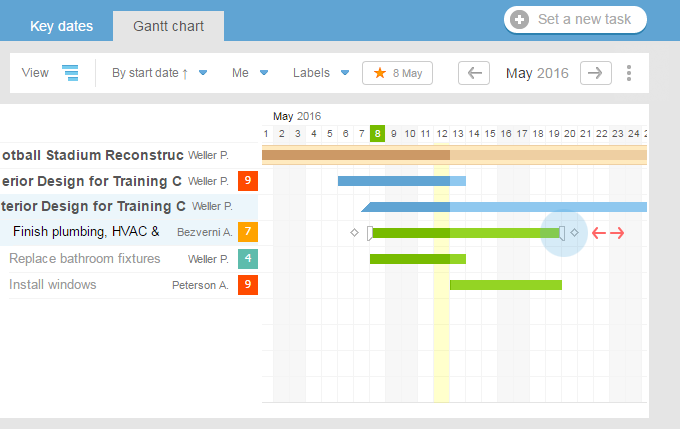
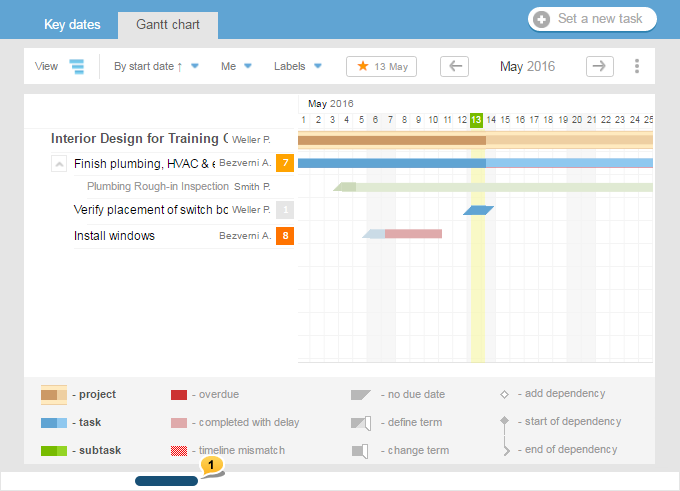
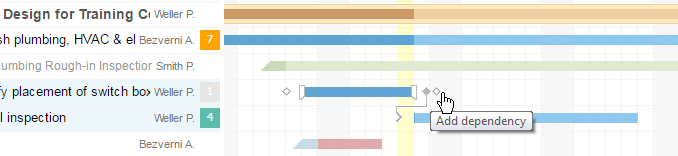
Gantt chart represents the segments placed on a horizontal time scale. Each segment corresponds to a single project, task, or subtask. Projects, tasks, and subtasks that make up the plan are placed vertically. Start, end, and length of the segment on the timeline correspond to the beginning, end, and duration of the task.

Was this article helpful? Yes, thank you! No

How to change the timeframe of projects and tasks in the Gantt chart?

To change the timeframe on the Gantt chart, drag the sliders corresponding to the date of the start and completion.


When you are working with a chart, the system saves all changes and stores them until the browser is closed. You can easily go to another page, and resume the planning and timing of the change upon return.

Once the planning is finished, do not forget to save your changes. At the same time, having noted the relevant paragraphs, you can inform the artists and project managers about the new terms by using e-mail notifications.


Please, note! Change in the timeframes of projects, tasks, and subtasks on the Gantt chart can only be done by users with administrator permissions.
Was this article helpful? Yes, thank you! No

Why do some of the tasks are marked in red, and what is the meaning of different colors and shapes?

The diagram uses a simple color coding to facilitate the perception of information. The project, tasks, and subtasks are all in different colors. Additionally, the intensity of the color and shape of the segments’ ends also carries meaning. The red marks overdue task, while light red indicates a job done with a delay or conflicting with the terms of parental tasks.

It may sound quite complicated but it is quite easy in practice. Chart’s legend is always at hand.


Was this article helpful? Yes, thank you! No

Is it possible to change the scale of a diagram? How to move the chart back and forth in time? Which tasks are displayed in the diagram?

The scale of the Gantt chart is fixed when viewed in a browser. With the standard scale, a temporary period of two months is placed on the screen. However, using the horizontal scroll bar at the bottom of the screen1 (or «right» and «left» cursor arrows), you can move the chart back and forth in time.


When scrolling the chart, only those tasks remain in the list of tasks that fall within the length of time visible on the screen.

The time interval can also be set manually to display tasks. In order to do this, you just need to click on the start and end dates (not necessarily by aAscending date). Dates in the selected range will be highlighted in yellow color, and only those tasks will be displayed that fall (at least partially) in the selected interval.


If do not click on a date but on a month, then the entire month will be selected as the interval.


When printing, you can change the chart scale to increase the range of dates that can fit on the screen.

The diagram can be 2 or 4-times (see the answer to the questions).
Was this article helpful? Yes, thank you! No

How to print a Gantt chart?

For this, on the page with the chart, click the drop-down context menu and select «Print»1.


In the appeared window, you can select the page size and specify temporary time scale of the diagram (1,2 or 4 days).

When changing the scale to «day 2», the time interval two times bigger will fit on the printout, the same way as if you change it to «4 days», it will be 4 times larger.


Please, note! In order for the Gantt chart to be printed correctly, background colors and images must be enabled in the browser2.

Was this article helpful? Yes, thank you! No

How to set up a link between tasks on Gantt chart? How to link/unlink tasks?

Two basic and most used types of links in Worksection that determine the start date of the tasks: start-start and finish-start.

01 | Start-Start — task B starts right away or after N days after the start of the task A. If the start date of the A task changes, then the start date of the B task also moves.
For example: As soon as the client «signed the agreement», then the executive manager «arranges a meeting» wit the client, and «webinar for employees» of the client opens in 3 days.


02 | Finish-Start — task B starts right away or after N days after the completion of the task A. If task A is expired, then the start of task B is postponed till the task A is not closed. If task А is completed before the deadline, then the planned start of task B will happen earlier.
For example: As soon as «budget coordination with the client» is completed, lawyers «get the agreement ready».

To establish links between tasks, jump to the Gantt chart. Then click on the icon ♦ (set the start of the link) next to task A and> (set the end of the link) next to task B or right on task B.


After establishing the links, the system will remember the number of days between task A and task B, and any changes to the time frames of task A will also affect task B. If you decide to change the time frames of task B, the system will simply remember the new number of days. Breaking the link can be done by clicking at its end.


You can establish links between tasks and subtasks from different projects, which helps to plan the employment of individual employees.
Similarly to setting time frames, application of changes and notification sending occurs after you click «Save». You can plan the entire project and only then notify the executives.


The option of linking tasks is available in Optimum and tariff plans above it
https://worksection.com/en/price.html
Was this article helpful? Yes, thank you! No

Why can't I link two tasks? Are there limitations when setting dependencies?

Yes, there are limitations.

Limitations when setting dependencies

  • any number of tasks or subtasks can be dependent on a task, however, the task itself can be dependent on only one task
  • The start of task B cannot be set earlier than the start/finish of the task А (depending on the type of dependency), therefore, you cannot set a shorter time period either on the Gannt chart or when editing the task
  • you cannot create cyclic dependencies (i.e.task А depends on task B, and task B depends on task А)
  • in order to eliminate confusion, we are no longer allowing dragging time frames of the tasks that have dependencies on the calendar of events and change their time frames with the bulk operations option
Dependency setting in between tasks is available in the tariff plans Optimal and higher.

Was this article helpful? Yes, thank you! No
esc
или
Print